CITATIONS
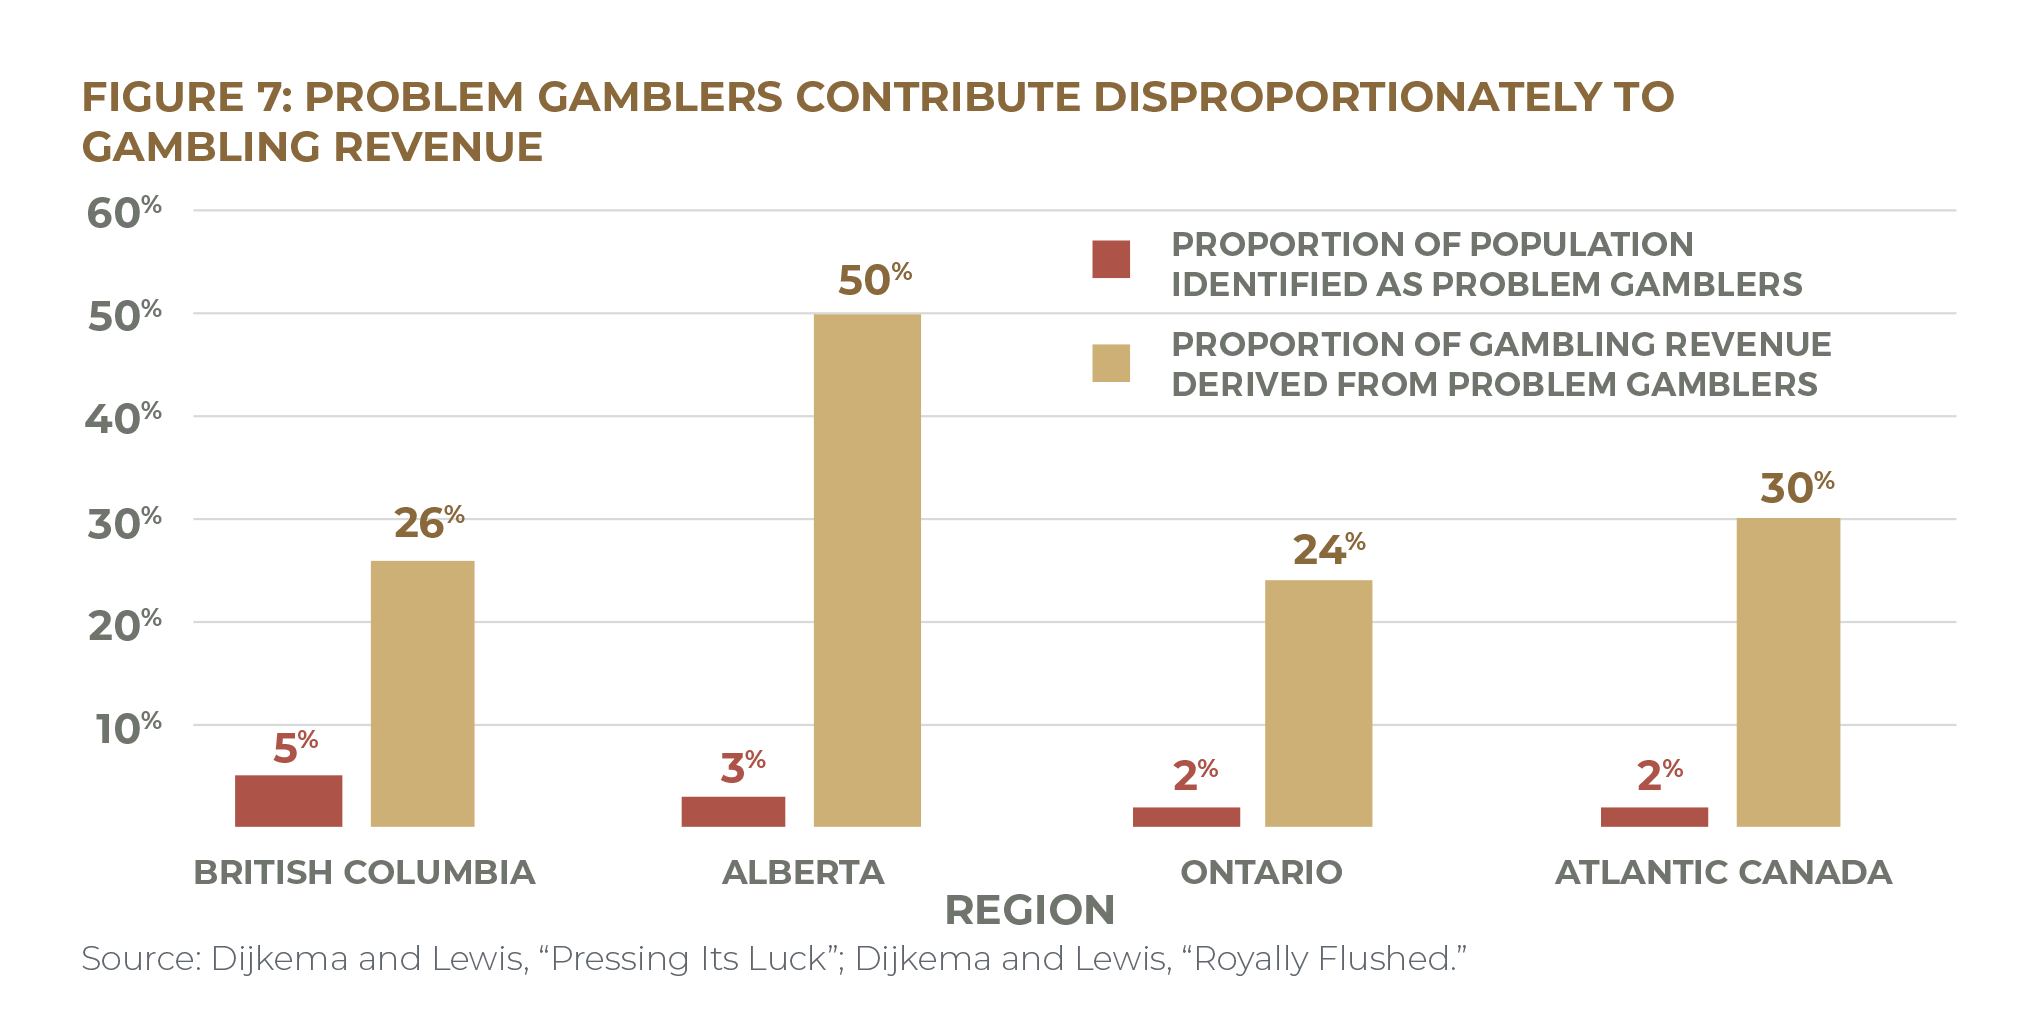
1) Dijkema and Lewis, “Pressing Its Luck”; Dijkema and Lewis, Royally Flushed.
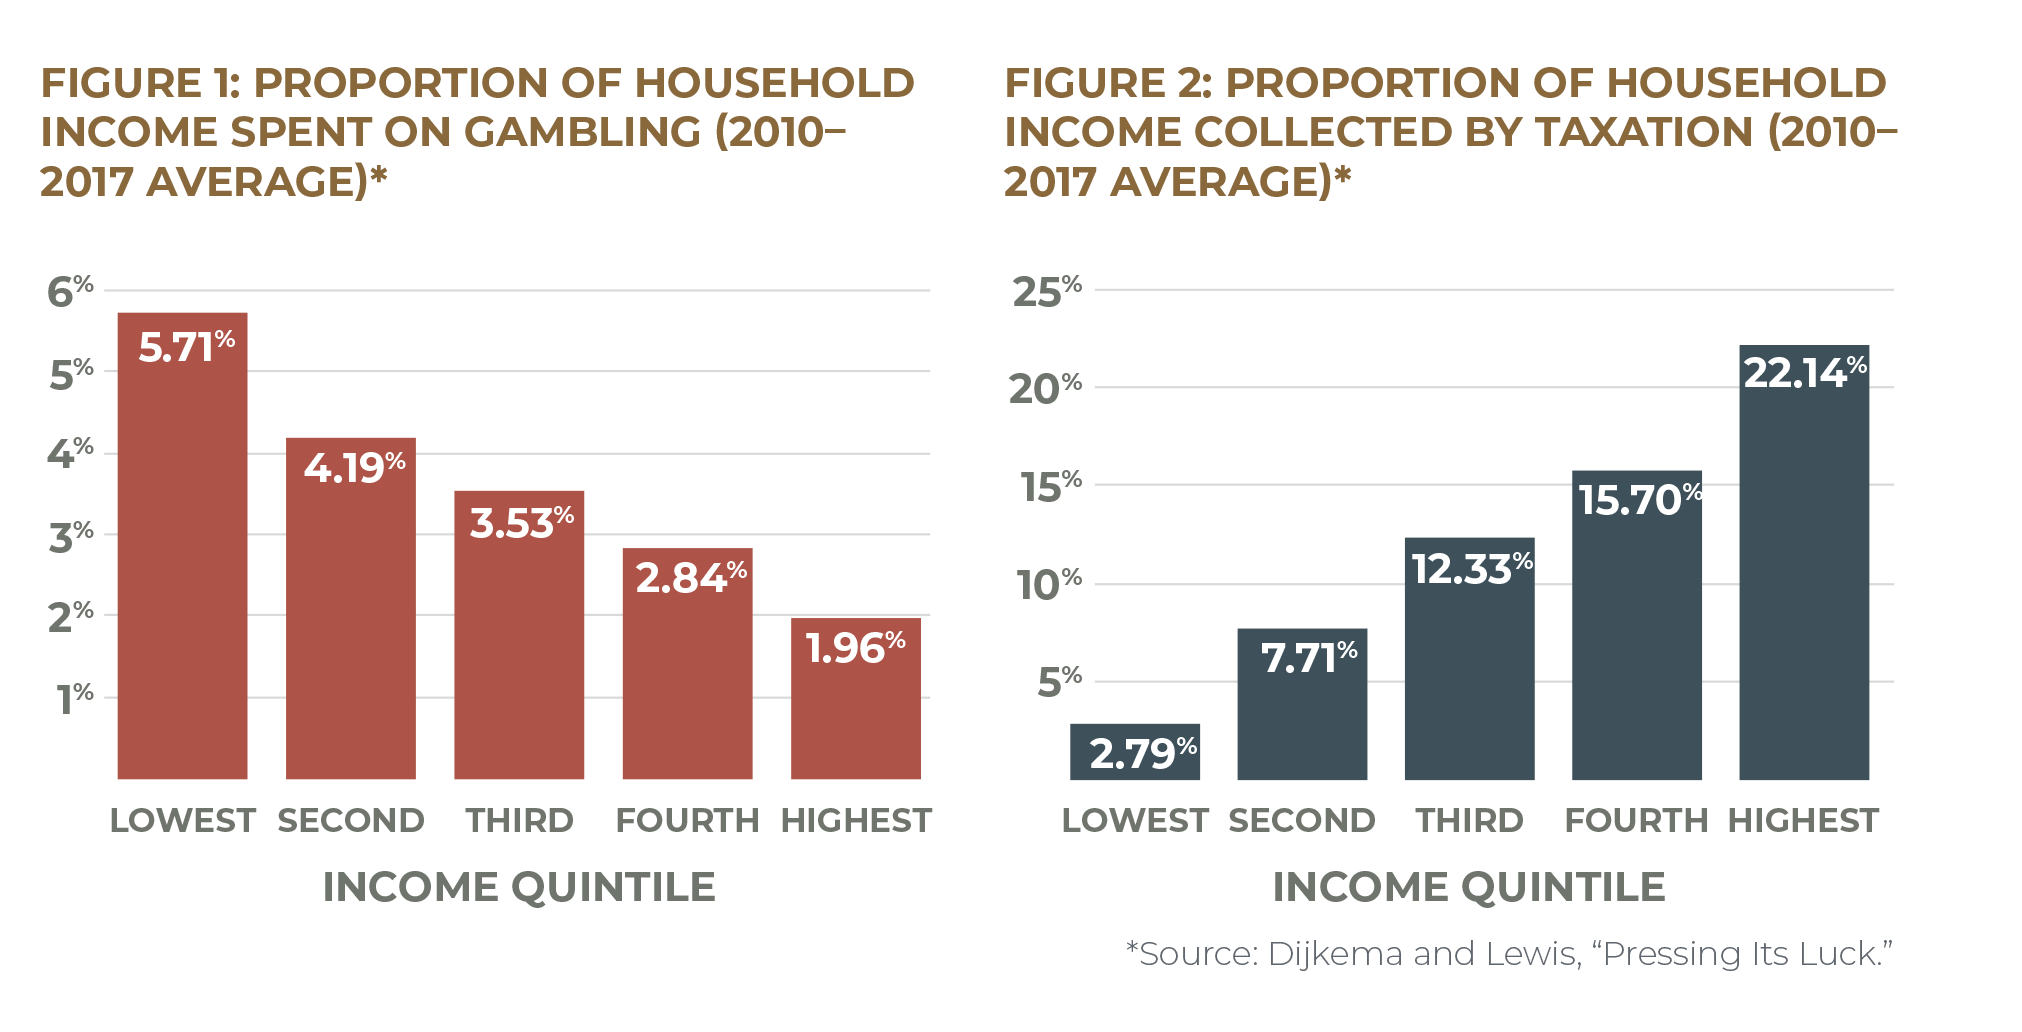
2) Author’s calculations based on data from Statistics Canada, “Table 11-10-0193-01,” and Statistics Canada, “Table 11-10-0223-01.” For details on calculation methodology, see Dijkema and Lewis, “Pressing Its Luck.”
3) Williams and Wood, “What Proportion of Gambling Revenue”; Alberta Gambling Research Institute, “Adult Prevalence Studies of Problem Gambling.” Estimates of problem gambling prevalence can vary by jurisdiction and the way that problem gambling is defined and measured in a given study.
4) Gamblers Anonymous, “Recovery Program.”
5) Dijkema and McKendry, “Banking on the Margins,” 19–20.
6) Scott, “34% of Canadians Plan to Retire by Winning the Lottery”; TD, “Ontario Boomers Not Ready for Retirement”; CFA and FPA, “How Americans View Personal Wealth”; see also Kingston, “Retirement 6/49.”
7) Côté, Mazer, and Weisstub, “Canada Saver’s Credit,” 3; Rothwell and Robson, “Prevalence and Composition,” 18.
8) Shillington, “Are Low-Income Savers Still in the Lurch?”
9) Rothwell and Robson, “Prevalence and Composition,” 17.
10) Statistics Canada, “Household Economic Well-Being During the COVID-19 Pandemic.”
11) Côté, Mazer, and Weisstub, “Canada Saver’s Credit,” 10.
12) Bank of Montreal, “BMO Household Savings Report.”
13) Côté, Mazer, and Weisstub, “Canada Saver’s Credit,” 10.
14) Parliamentary Budget Officer, “Household Indebtedness and Financial Vulnerability.”
15) John, Butler, and Rust, “Boosting Economic Mobility Through Prize-Linked Savings.”
16) Côté, Mazer, and Weisstub, “Canada Saver’s Credit,” 11.
17) McKernan et al., “Thriving Residents, Thriving Cities.”
18) Dijkema and McKendry, “Banking on the Margins,” 20; Pyper, “Payday Loans,” 8.
19) Bank of Montreal, “BMO Rainy Day Survey.”
20) Many Canadians are asset-poor, making them particularly vulnerable to the loss of income accompanying an unexpected layoff. See Robson, “Assets in the New Government of Canada Poverty Dashboard”; Compass Working Capital, “Why Asset Poverty Matters”; Robson and Rothwell, “A Tale of Two Trends.”
21) Financial assets include “all non-pension financial assets at market value, i.e., all bank accounts, term deposits, mutual funds, stocks, bonds, and registered savings plans.” The ability to cover basic living expenses is defined as the ability to maintain a household at 50 percent of the median income. Rothwell and Robson, “Prevalence and Composition”; see also Alini, “Coronavirus.”
22) Gopnik and Collins, “Emergency Savings.”
23) Rothwell and Robson, “Prevalence and Composition,” 18; Momentum, “Asset Building.”
24) Cramer et al., “A Penny Saved Is Mobility Earned,” 2.
25) McKernan et al., “Thriving Residents, Thriving Cities.”
26) Loibl, Kraybill, and DeMay, “Accounting for the Role of Habit in Regular Saving.”
27) Canada Revenue Agency, “GST/HST Credit.”
28) Government of Canada, “Canada Workers Benefit.”
29) Government of Canada, “Old Age Security.”
30) Government of Canada, “Guaranteed Income Supplement.”
31) Government of Canada, “Canada Child Benefit.”
32) Author’s calculations based on the number of adults (eighteen years and older) living below the poverty line, defined using Statistics Canada’s market-basket measure. Statistics Canada, “Table 11-10-0135-01: Low Income Statistics by Age, Sex and Economic Family Type”; Ontario Lottery and Gaming, “Annual Report 2017–18”; Atlantic Lottery Corporation, “Annual Report 2017–18”; Alberta Gaming, Liquor and Cannabis Corporation, “Annual Report 2017–18”; British Columbia Lottery Corporation, “2017/18 Annual Service Plan Report.”
33) Fortin et al., “Canadian Inequality.”
34) Harding, “The Effect of Government Transfer Programs.” This analysis did not account for behavioural effects of transfer programs, such as labour market or social decisions made in response to government transfer policies.
35) Marinescu, “No Strings Attached.”
36) Pega et al., “Unconditional Cash Transfers”; Baird et al., “Conditional, Unconditional and Everything in Between”; Bastagli et al., “Cash Transfers.”
37) Harding, “The Effect of Government Transfer Programs.”
38) Brown and Tarasuk, “Money Speaks.”
39) Lebihan and Mao Takongmo, “Unconditional Cash Transfers and Parental Obesity”; Milligan and Stabile, “Do Child Tax Benefits Affect the Well-Being of Children?”; Daley, “Income and the Mental Health of Canadian Mothers.”
40) Brownell et al., “An Unconditional Prenatal Income Supplement.”
41) Struthers et al., “Understanding the Particularities of an Unconditional Prenatal Cash Benefit.”
42) Halpern-Meekin, “It’s Not Like I’m Poor”; Edin, Tach, and Halpern-Meekin, “Tax Code Knowledge and Behavioural Responses among EITC Recipients”; Mendenhall et al., “The Role of Earned Income Tax Credit”; Shaefer, Song, and Williams Shanks, “Do Single Mothers in the United States Use the Earned Income Tax Credit to Reduce Unsecured Debt?”; Despard et al., “Do EITC Recipients Use Tax Refunds to Get Ahead?”; Smeeding, Ross Phillips, and O’Connor, “The EITC”; Jones and Michelmore, “The Impact of the Earned Income Tax Credit on Household Finances.” The effect of policies like the Working Income Tax Benefit or Earned Income Tax Credit on savings behaviour is not necessarily due to the payment alone—their labour-market incentives, for instance, may also contribute to regular saving by encouraging recipients to enter the labour force, which could increase income and the amount these recipients can put away. In other words, it may not be the money from the benefit itself that leads to saving, but the labour-supply effect of the benefit. Jones and Michelmore, “The Impact of the Earned Income Tax Credit,” for instance, finds evidence of substantial saving after receiving the Credit only when expansions to the benefit also increased earned income. McGranahan, “Tax Credits and the Debt Position of U.S. Households,” finds that households use their refunds to pay down delinquent debt—i.e., debt for which households are overdue on payment deadlines—but also to increase auto and credit card debt.
43) Despard et al., “Do EITC Recipients Use Tax Refunds to Get Ahead?”; Goodman-Bacon and McGranahan, “How Do EITC Recipients Spend Their Refunds?”; Smeeding, Phillips, and O’Connor, “The EITC”; for similar international evidence, see Raschke, “The Impact of the German Child Benefit on Child Well-Being”; Raschke, “The Impact of the German Child Benefit on Household Expenditures and Consumption.”
44) Jones, Milligan, and Stabile, “Child Cash Benefits and Family Expenditures.”
45) Adams, Amedah, and Fougère, “Measuring the Effect of Child Benefit on Household Expenditures.”
46) Di Matteo, “The Fiscal Wages of Sin.”
47) See, e.g., Laurin, “Two-Parent Families with Children.”
48) See, e.g., Eissa and Hoynes, “Behavioral Responses to Taxes”; Eissa and Liebman, “Labour Supply Response to the Earned Income Tax Credit”; Hotz and Scholz, “The Earned Income Tax Credit,”; Agostinelli, Borghesan, and Sorrenti, “Welfare, Workfare and Labor Supply”; Hasan, “Labour Supply Response to the Working Income Tax Benefit”; Annabi, Boudribilia, and Harvey, “Labour Supply and Income Distribution Effects of the Working Income Tax Benefit.”
49) Rothwell and Robson, “Prevalence and Composition,” 25.
50) See also Côté, Mazer, and Weisstub, “Canada Saver’s Credit.”
51) World Bank, “The Global Findex Database 2017.”
52) Consumer Financial Protection Bureau, “Increasing Saving at Tax Time.”
53) Momentum, “Incentivized Saving”; Azurdia and Freedman, “Encouraging Nonretirement Savings,” ES1–9.
54) Sherraden, Assets and the Poor.
55) Leckie et al., “Final Report,” 12.
56) Leckie, Dowie, and Gyorfi-Dyke, “Early Impacts,” 3.
57) Sherraden, “Innovations in Asset Building”; Feldman, “Saving from Poverty,” 185–88.
58) BBC News, “Budget: Saving Gateway Scheme Is Scrapped”; Kelly, “Welcome Back, Help to Save.”
59) GOV.UK, “Get Help with Savings if You’re on a Low Income (Help to Save).”
60) GOV.UK, “Get Help with Savings if You’re on a Low Income (Help to Save): Eligibility.” Participants can continue using their Help to Save accounts if they stop claiming benefits.
61) GOV.UK, “Get Help with Savings if You’re on a Low Income (Help to Save): How It Will Affect Your Benefits.”
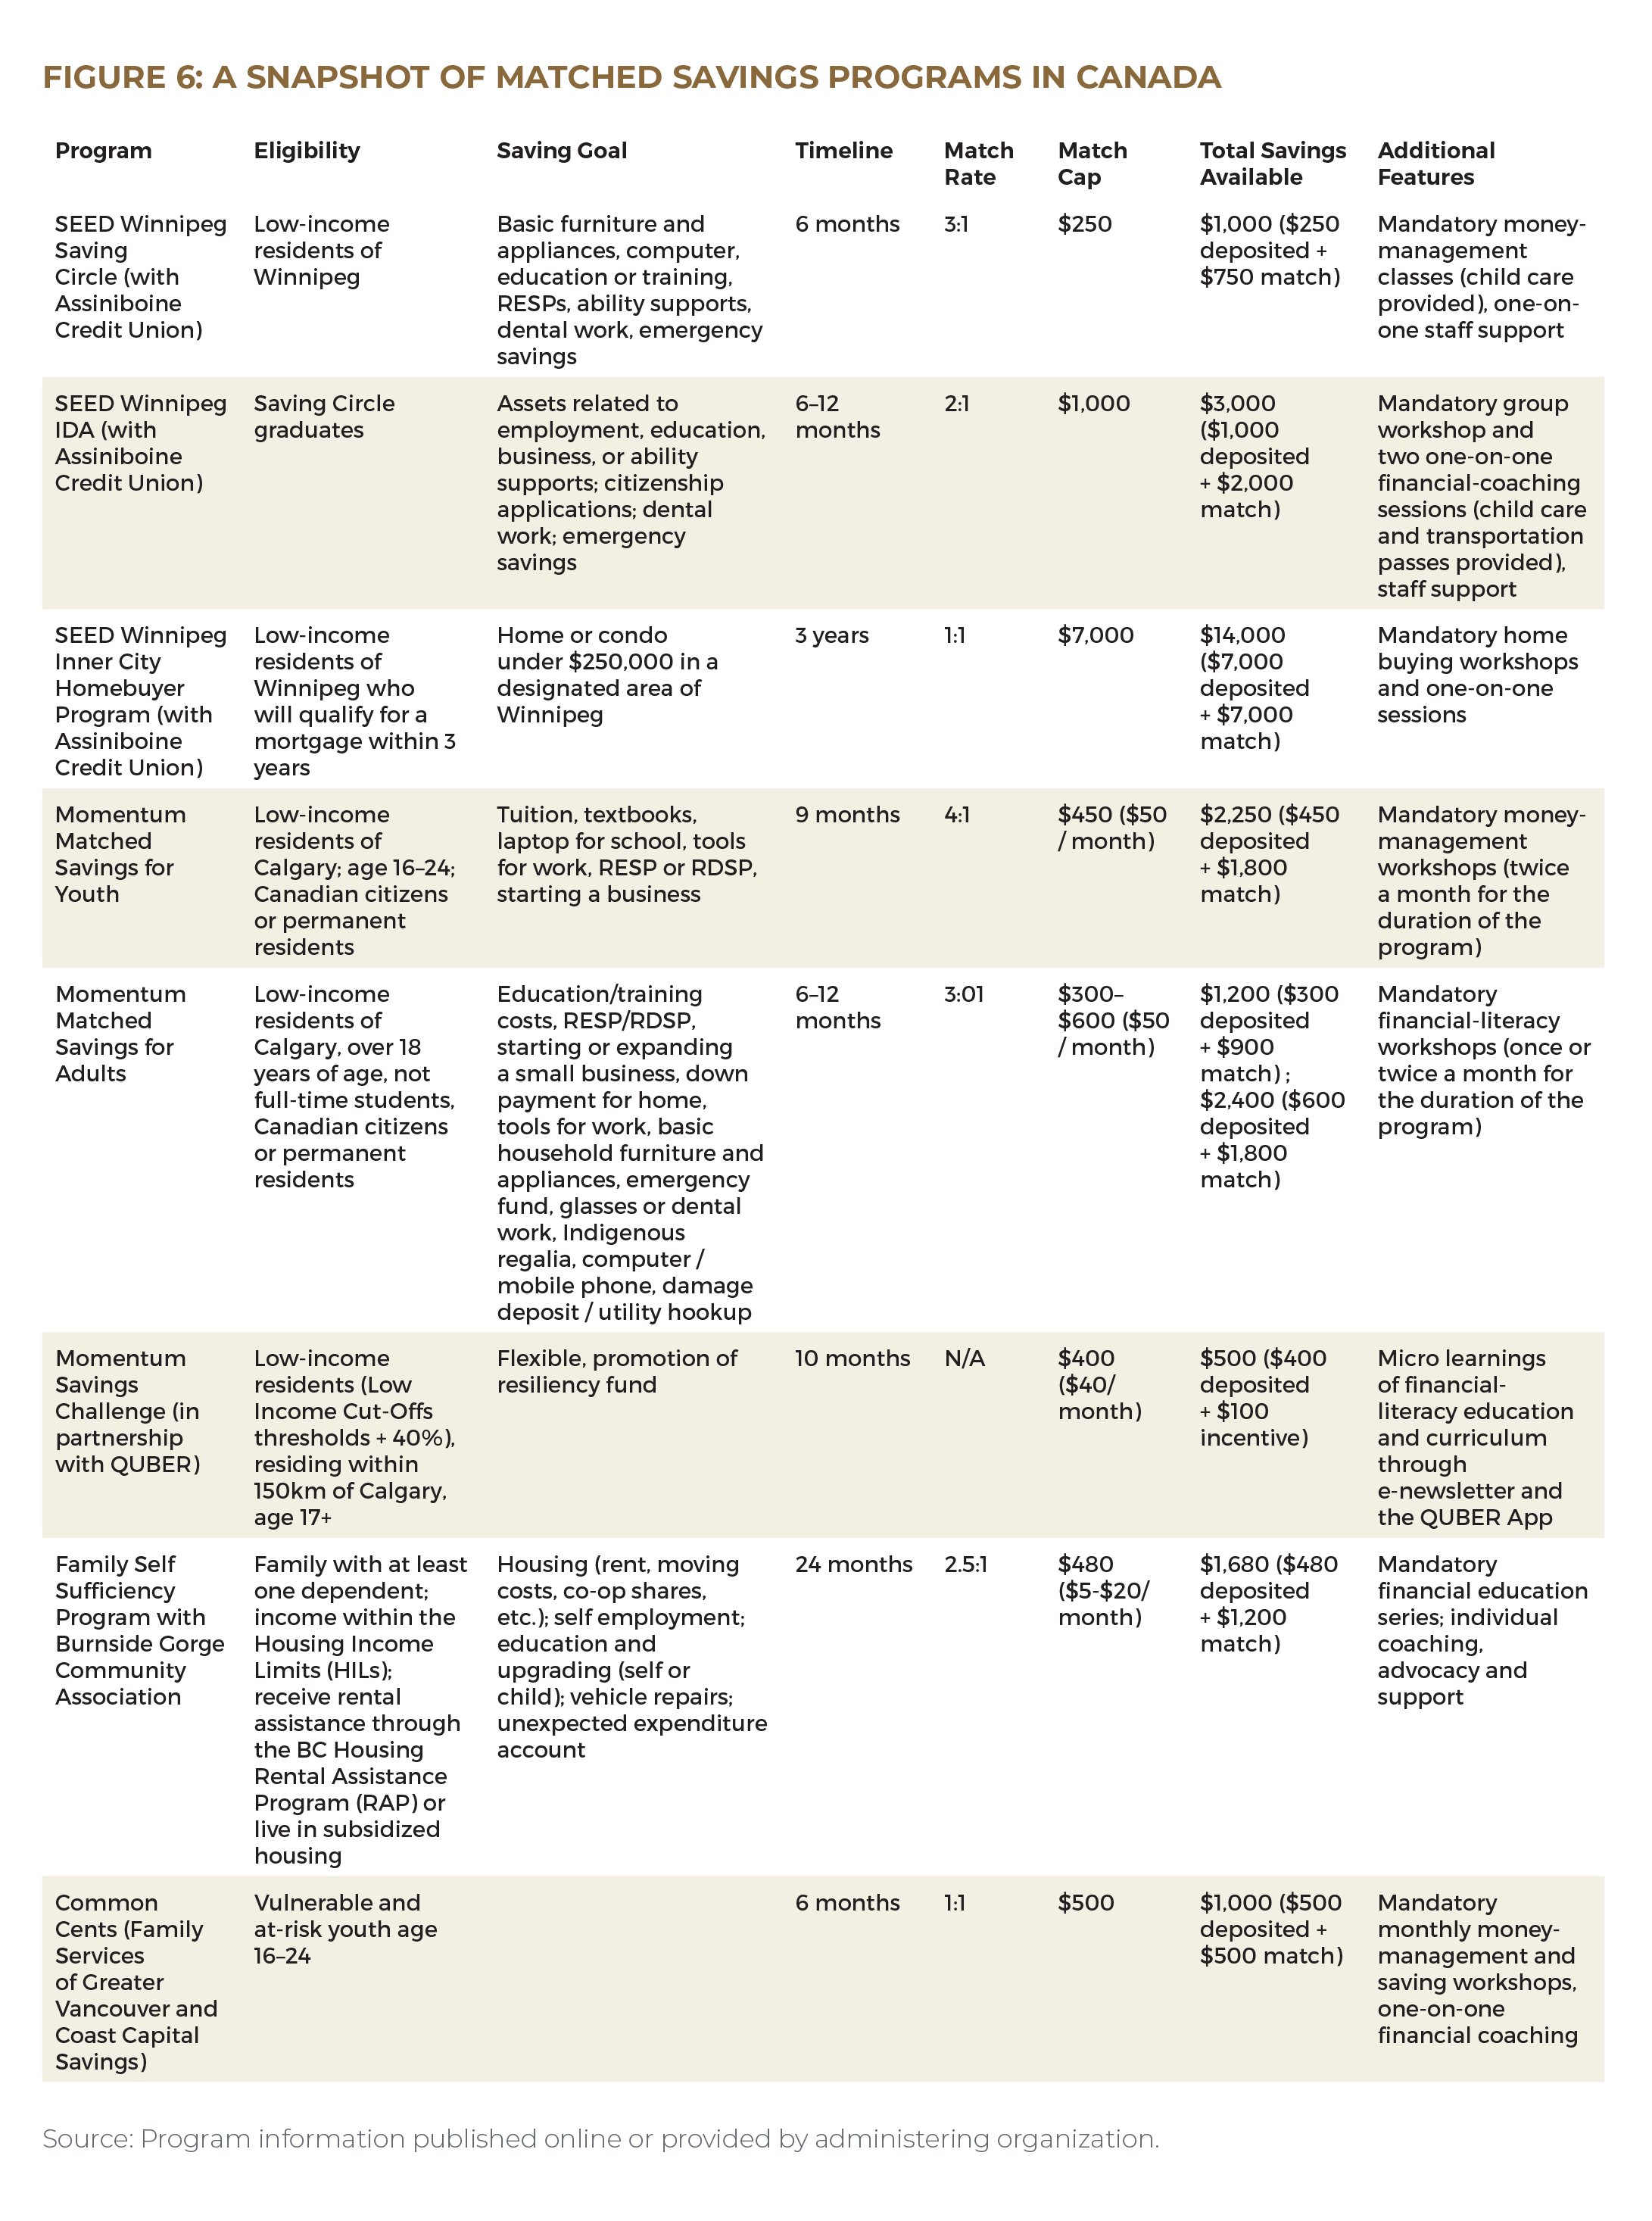
62) SEED Winnipeg, “Saving Circle”; SEED Winnipeg, “Saving Circle Booklet.”
63) SEED Winnipeg, “Individual Development Account”; SEED Winnipeg, “IDA Booklet.”
64) SEED Winnipeg, “Inner City Homebuyer Program.”
65) Momentum, “Matched Savings for Youth”; Peariso, “Youth Fair Gains.”
66) Momentum, “Matched Savings for Adults.”
67) Information provided by Momentum.
68) Information provided by Burnside Gorge Community Association. An additional asset-development opportunity exists for those living in subsidized non-profit housing. If their household income increases (and rent goes up) during the program, an escrow savings program will kick in: the difference between their rent rate at the start of the program and the higher rent rate will be set aside by the subsidy provider until the end of the three-year program, up to a cap of $7,500. Not all participants will be eligible for this program as rents do not often change.
69) Family Services of Greater Vancouver, “Coaching and Workshops.” Saving goal not specified.
70) Vancity, “Savings and Investments.”
71) Assiniboine Credit Union, “Asset Building Programs.”
72) Applicants’ household income could not be above 120 percent of the low income cut-off, and the program included liquid-asset limits to ensure that participants used the program to build new savings rather than moving their existing assets into the high-yielding learn$ave accounts. If an applicant owned a home—which would give him or her access to relatively cheap credit—it could not exceed the median value of homes in the area. Leckie et al., “Final Report,” 9–10, 26.
73) Leckie, Dowie, and Gyorfi-Dyke, “Early Impacts,” xi.
74) Leckie et al., “Final Report,” 15. Financial training was not specific to education and/or small business requirements.
75) The match rate was 3:1 at the three experimental sites, but some other sites offered match rates ranging from 2:1 to 5:1. To combat the risk of participants simply moving existing liquid assets into their learn$ave accounts rather than building a genuinely new saving habit, participants would qualify for matching credits only after making net deposits of at least $10 in each of twelve months (though these did not have to be consecutive). The program also included a match cap—the maximum deposit that would qualify for matched credits—of $250 per month. Leckie et al., “Final Report,” 11.
76) Leckie et al., “Final Report,” 12–13.
77) Leckie et al., “Final Report,” 104.
78) Leckie et al., “Final Report,” 69–70.
79) Leckie et al., “Final Report,” 75. Measures of hardship included difficulty meeting expenses, needing to borrow to meet needs, food bank use, bankruptcy, and overdue bills at month forty. Participants also rated their life satisfaction on a scale of one to ten.
80) Leckie et al., “Final Report,” 104.
81) Leckie et al., “Final Report,” 3.
82) See Harvey et al., “Final Evaluation,” 5.
83) Leckie et al., “Final Report,” 54.
84) See, e.g., Proactive Information Services, “Matched Savings Programs.”
85) Leckie et al., “Final Report,” 103; see also Elliot, “IDA Accessibility,” 1–2.
86) Loibl et al., “More than a Penny Saved,” 122.
87) Loibl, Kraybill, and DeMay, “Accounting for the Role of Habit in Regular Saving.”
88) Sherraden and McBride, Striving to Save.
89) Harvey et al., “Final Evaluation,” 5.
90) Proactive Information Services, “Matched Savings Programs,” iii.
91) Proactive Information Services, “Matched Savings Programs,” iv.
92) Momentum, “The Impact of Matched Savings.”
93) Momentum, “Investing in Youth.”
94) Proactive Information Services, “Matched Savings Programs,” 26.
95) Proactive Information Services, “Matched Savings Programs,” 32–33.
96) Sherraden, “Innovations in Asset Building,” 198.
97) Leckie et al., “Final Report,” 3.
98) Loibl et al., “More than a Penny Saved,” 100.
99) Voyer, “Impacts of a Matched Saving Program.”
100) Leckie et al., “Final Report,” 44.
101) Leckie et al., “Final Report,” 13.
102) Leckie et al., “Final Report,” 45.
103) Leckie et al., “Final Report,” 101–2.
104) For example, Rablen, “The Saving Gateway,” finds that the Saving Gateway program would be effective at increasing assets for credit-constrained agents, but not for those with access to credit.
105) Leckie et al., “Final Report,” 105.
106) Leckie et al., “Final Report,” 75.
107) Loibl et al., “More than a Penny Saved,” 119; SEDI, “Financial Capability and Poverty,” 6.
108) See Leckie, Dowie, and Gyorfi-Dyke, “Early Impacts,” 21.
109) Boshara, “Individual Development Accounts.”
110) Leckie et al., “Final Report,” 105. The authors note that learn$ave’s per-person price tag appears more reasonable when you consider the corresponding benefits over the long term: a thirty-three-year-old who enrols in additional education as a result of participating in the program needs to experience an earnings boost of only $2,400 per year over the rest of his or her career to cover this cost.
111) Leckie et al., “Final Report,” 94.
112) Leckie et al., “Final Report,” 105.
113) Leckie et al., “Final Report,” 3.
114) SEDI, “Financial Empowerment,” 6.
115) Kingwell et al., “Helping People Help Themselves,” 17–19.
116) Loibl et al., “More than a Penny Saved,” 106; Harvey et al., “Final Evaluation,” 3, 137.
[2] Elliot, “IDA Accessibility”; Feldman, “Saving from Poverty.”
117) Elliot, “IDA Accessibility”; Feldman, “Saving from Poverty.”
118) Feldman, “Saving from Poverty,” 189; Loibl et al., “More than a Penny Saved,” 101.
119) Most participants in the Saving Gateway pilot, for example, reported that their contributions did not come from existing savings. At the same time, however, most participants did not report cutting back their spending to finance their contributions, raising questions about where the money for deposits came from. There was, however, a significant link between participation in the program and a reduction in spending on food consumed outside the home (i.e., eating out) among certain participants, namely, the lower-income group and those in rented accommodation. Harvey et al., “Final Evaluation,” 6.
120) Harvey et al., “Final Evaluation,” 5.
121) Feldman, “Saving from Poverty,” 190–91.
122) Loibl et al., “More than a Penny Saved,” 117.
123) Harvey et al., “Final Evaluation,” 7.
124) Rothwell and Sultana, “Cash-Flow and Savings Practices of Low Income Households”; Tucker, Key, and Grinstein-Weiss, “The Benefits of Saving at Tax Time”; see also Feldman, “Saving from Poverty,” 189.
125) Leckie et al., “Final Report,” 87.
126) Leckie et al., “Final Report,” 4; Loibl, Kraybill, and DeMay, “Accounting for the Role of Habit in Regular Saving,” 590; Consumer Financial Protection Bureau, “Perceived Financial Preparedness, Saving Habits, and Financial Security”; Consumer Financial Protection Bureau, “Financial Well-Being in America.”
127) Some PLS products also include guaranteed interest in addition to the prize pool.
128) Kearney et al., “Making Savers Winners,” 31–32.
129) Save To Win, “Frequently Asked Questions”; Michigan Credit Union League, “Save To Win.”
130) Cole, Iverson, and Tufano, “Can Gambling Increase Savings?,” 2.
131) Commonwealth, “Prize-Linked Savings Policy.”
132) Walmart, “Walmart and Green Dot Unveil First National Prize-Linked Savings Program”; Walmart, “Two Years Later”; Walmart, “Walmart MoneyCard Prize Savings Sweepstakes.” If someone has more than $500 in the Vault, they will still earn only five hundred entries, based on a calculation of average daily balance. This feature prevents cardholders with very large Vault balances receiving a disproportionate share of entries in each draw.
133) PYMNTS, “Walmart to Customers.”
134) Watson, “Save Now, Win Later,” 913; Kearney et al., “Making Savers Winners,” 9–12.
135) National Savings and Investments, “Our Story.”
136) National Savings and Investments, “Premium Bonds.”
137) Michigan Credit Union League, “Save To Win”; Commonwealth, “Prize Linked Savings in Credit Unions: 2019.”
138) Walmart, “Two Years Later.”
139) Barker, “Premium Bonds.”
140) Cole, Iverson, and Tufano, “Can Gambling Increase Savings?,” 3.
141) Filiz-Ozbay et al., “Do Lottery Payments Induce Savings Behavior?”; Atalay et al., “Saving and Prize-Linked Savings Accounts.”
142) Commonwealth, “Prize-Linked Savings in Credit Unions in 2018.”
143) Kearney et al., “Making Savers Winners,” 12.
144) Tufano, De Neve, and Maynard, “U.S. Consumer Demand for Prize-linked Savings,” 117.
145) Atalay et al., “Savings and Prize-Linked Savings Accounts.”
146) Tufano, “Saving Whilst Gambling,” 322; Kearney et al., “Making Savers Winners,” 5.
147) See, e.g., Kearney et al., “Making Savers Winners,” 18; Cole, Iverson, and Tufano, “Can Gambling Increase Savings?”, 2; Doorway to Dreams Fund, “A Winning Proposition.”
148) Tufano, De Neve, and Maynard, “U.S. Consumer Demand for Prize-Linked Savings,” 117.
149) Atalay et al., “Saving and Prize-Linked Savings Accounts.”
150) Filiz-Ozbay et al., “Do Lottery Payments Induce Savings Behavior? Evidence from the Lab,” 17.
151) Commonwealth, “WINcentive Savings 2019,” 7.
152) National Savings and Investments, “Premium Bonds.”
153) Commonwealth, “WINcentive Savings 2019 Report,” 3.
154) Pew Charitable Trusts, “Can Contests Help Fill Americans’ Savings Gap?”
155) Watford, “Save Now, Win Later,” 911.
156) Cole, Iverson, and Tufano, “Can Gambling Increase Savings?,” 37.
157) Jindapon, Sujarittanonta, and Viriyavipart, “Prize-Linked Savings Games.”
158) Tufano, De Neve, and Maynard, “U.S. Consumer Demand for Prize-Linked Savings,” 117.
159) Atalay et al., “Saving and Prize-Linked Savings Accounts,” 100.
160) Cole, Iverson, and Tufano, “Can Gambling Increase Savings?,” 2.
161) Cookson, “When Saving Is Gambling,” 1–2. The substitution effect is much stronger among gamblers who display evidence of greater self-control. Those with low self-control do not change their spending in response to the introduction of PLS.
162) Doorway to Dreams Fund, “A Winning Proposition.”
163) Holmes, “Prize-Linked Savings,” 15; see also Doorway to Dreams Fund, “A Winning Proposition.”
164) Commonwealth, “Prize-Linked Savings in Credit Unions in 2018”; Kearney et al., “Making Savers Winners”; Commonwealth, “Walmart MoneyCard Prize Saving”; Cole, Iverson, and Tufano, “Can Gambling Increase Savings?”
165) Commonwealth, “Prize-Linked Savings in Credit Unions in 2018.”
166) Commonwealth, “The State of Prize-Linked Savings.”
167) Commonwealth, “Walmart MoneyCard Prize Savings: One Year Anniversary Brief.”
168) Demirguc-Kunt et al., “Global Findex Database 2014,” 83–84.
169) Canada Prepaid Providers Organization, “Canadian Open-Loop Prepaid Market is Growing”; Canadian Prepaid Providers Organization, “How Canadians Pay Today.”
170) See Dubner and Lam, “Is America Ready.”
171) Kearney et al., “Making Savers Winners,” 2–6.
172) Holmes, “Prize-Linked Savings,” 6–7.
173) Kearney et al., “Making Savers Winners,” 6.
174) Walker, “How to Trick People into Saving Money.”
175) Cole, Iverson, and Tufano, “Can Gambling Increase Savings?,” 38.
176) Kowalski, “Prize-Linked Savings Products,” 139.
177) Burke, “Can Prize-Linked Incentives Promote Debt Reduction.”
178) Holmes, “Prize-Linked Savings.”
179) Canada, Criminal Code, RSC 1985, c. C-34, s. 74.06; Canada, Criminal Code, RSC 1985, c. C-46, s. 206–207; Canadian Contest Law, “Contests.”
180) QUBER, “Terms and Conditions.”
181) Rolland, “D2D Tests Innovations,” 3.
182) See Baxter, “Prize-Linked Savings Promotions.”
183) Kearney et al., “Making Savers Winners,” 12–14.
184) The Pew Charitable Trusts, “Can Contests Help Fill Americans’ Savings Gap?,” 2.
185) Commonwealth, “The State of Prize-Linked Savings.”
186) Walker, “How to Trick People into Saving Money.”
187) Pew Charitable Trusts, “Can Contests Help Fill Americans’ Savings Gap?” Another factor that may contribute to low take-up rates is the structure of Save To Win and WINcentive, both of which involve a fairly restrictive certificate of deposit with significant withdrawal restrictions. A more flexible, liquid savings account offered alongside or in place of a standard savings account might have much higher take-up.
188) Save To Win was introduced in 2009, fifty-three years after the Premium Bond program was launched. Michigan Credit Union League, “Save To Win”; National Savings and Investments, “Our Story.”
189) Hiscott, “Post Office to Stop Selling Premium Bonds”; Doorway to Dreams Fund, “A Winning Proposition,” 2.
190) See, e.g., Statistics Canada, “One-Quarter of Canadian Businesses”; BNN Bloomberg, “76% of Canadians Now Bank Online or through an App, Poll Finds.”
191) See Guillén and Tschoegl, “Banking on Gambling,” 223; Pfiffelmann, “What Is the Optimal Design for Lottery-Linked Savings Programmes?,” 4870–71; Kowalski, “Prize-Linked Savings Products,” 139.
192) Tufano, “Saving whilst Gambling,” 323–24.
193) Holmes, “Prize-Linked Savings,” 13.
194) Filiz-Ozbay et al., “Do Lottery Payments Induce Savings Behavior? Evidence from the Lab,” 18.
195) See Doorway to Dreams Fund, “A Winning Proposition,” 5.
196) Holmes, “Prize-Linked Savings,” 14.
197) See also John, Butler, and Ross, “Boosting Economic Mobility Through Prize-Linked Savings.”
198) Kearney et al., “Making Savers Winners,” 5.
199) Commonwealth, “WINcentive Savings 2019 Report,” 6.
200) Williams et al., “Gambling and Problem Gambling in Canada in 2018.”
201) Angus Reid Institute, “Canadians Don’t Want to Roll the Dice.”
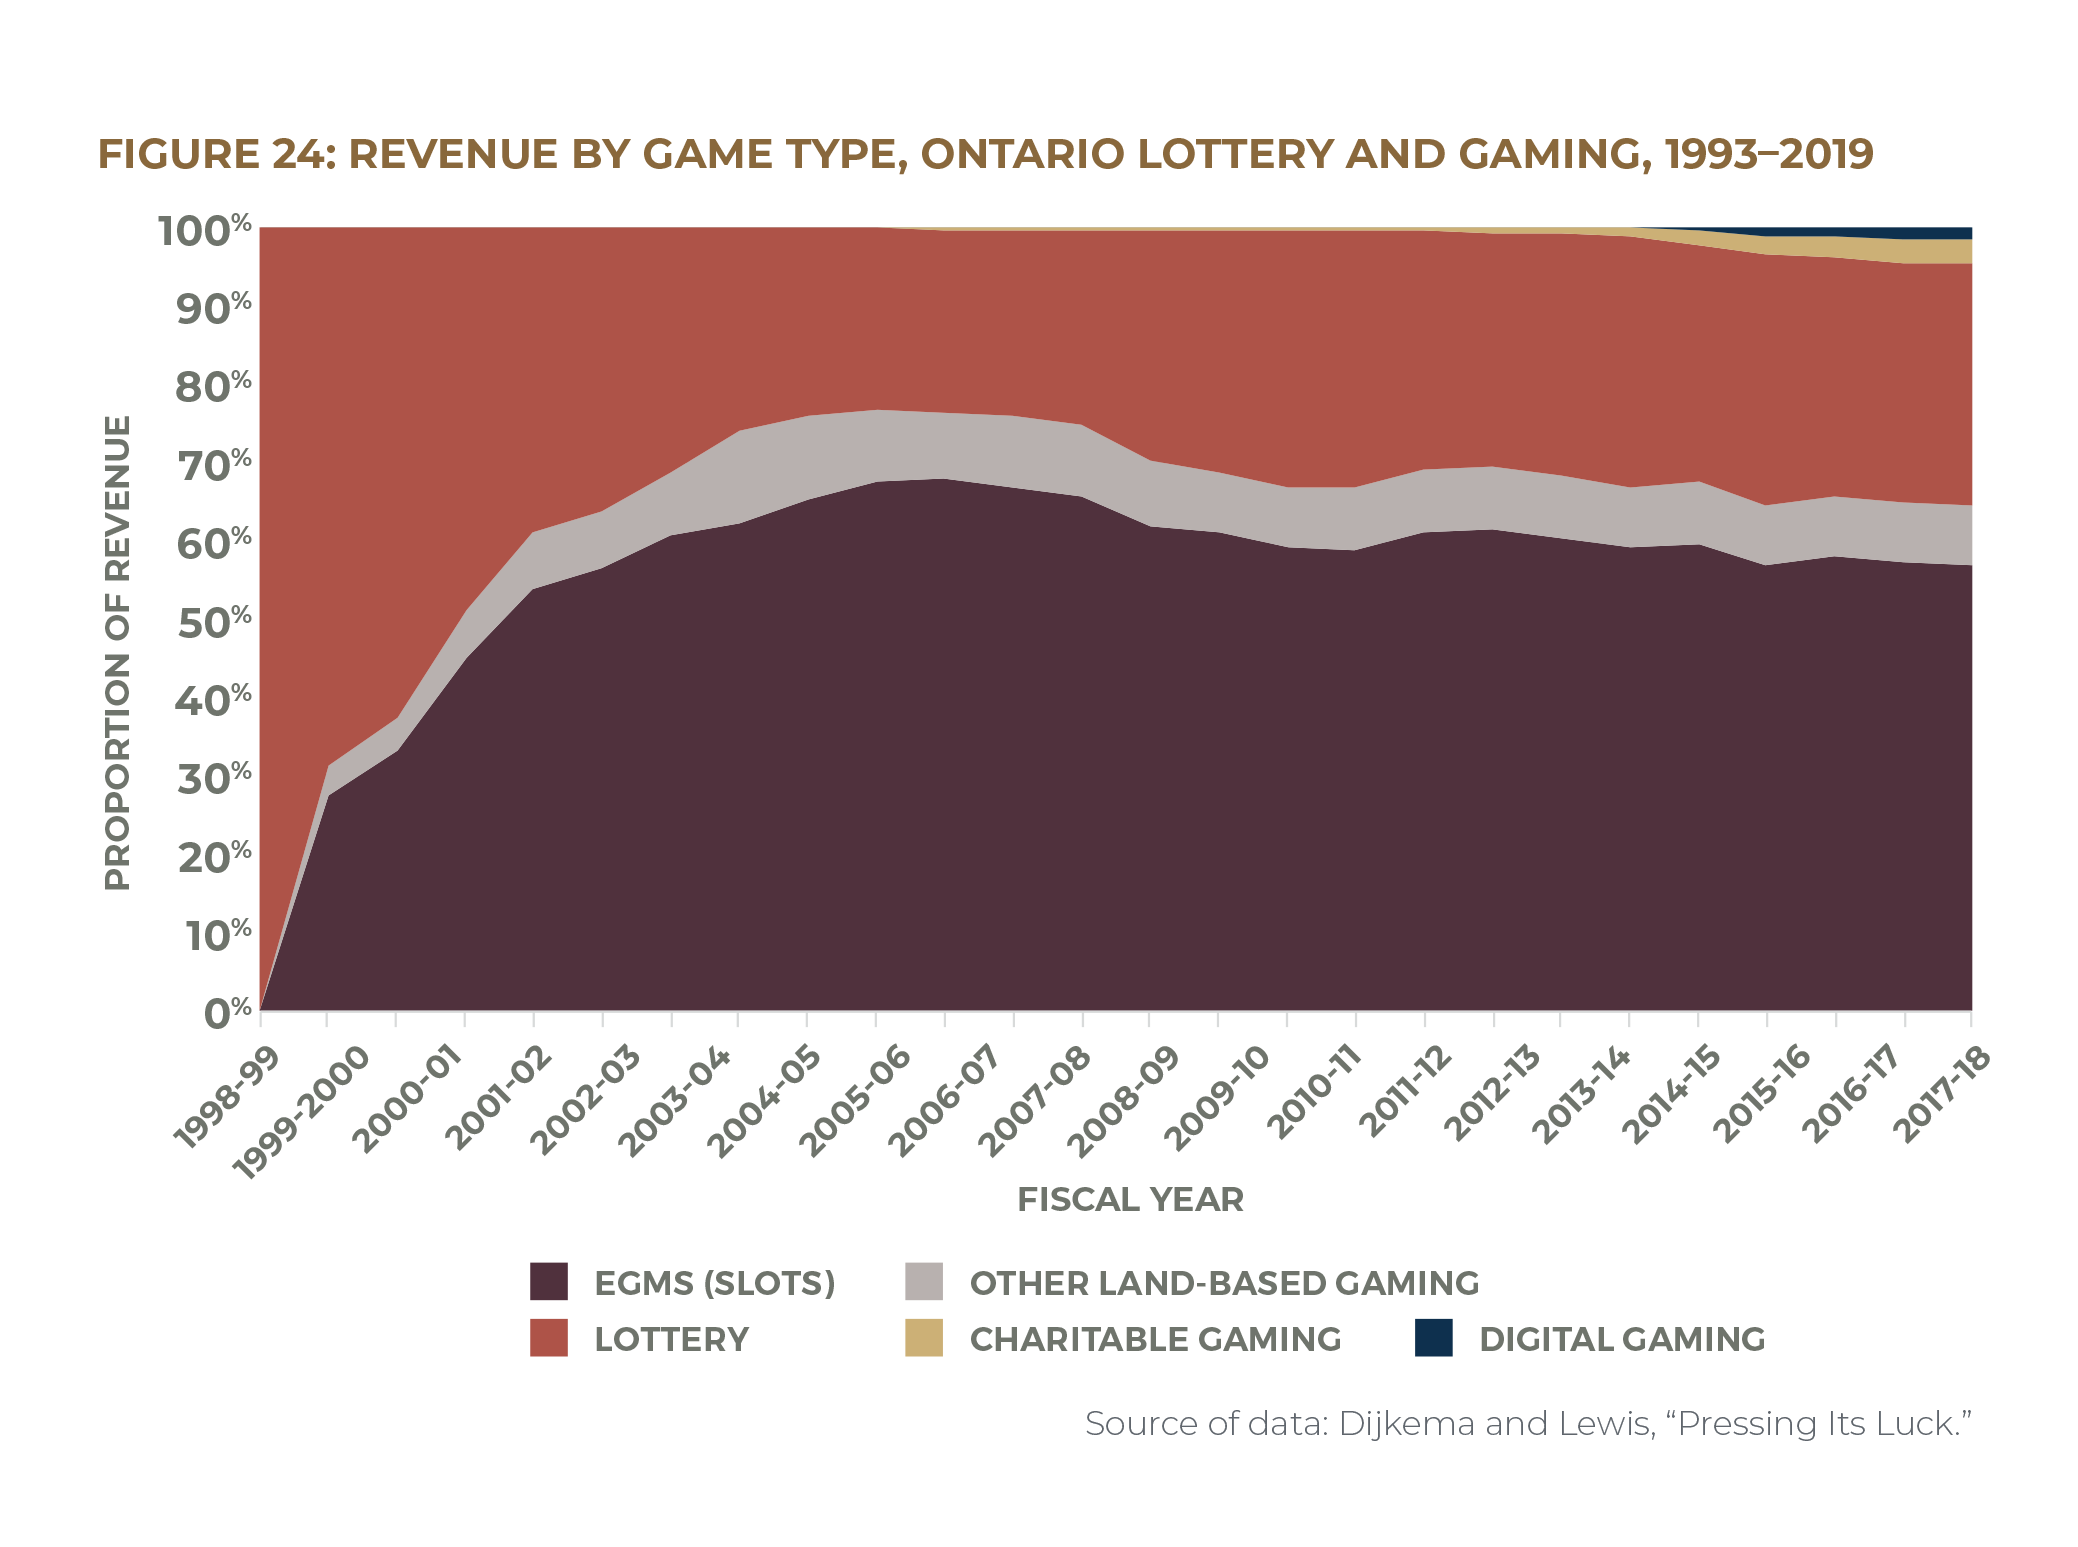
202) Williams and Volberg, “Gambling and Problem Gambling in Ontario”; British Columbia Provincial Health Officer, “Lower the Stakes”; Williams, Belanger, and Arthur, “Gambling in Alberta”; Williams and Wood, “What Proportion of Gambling Revenue.”
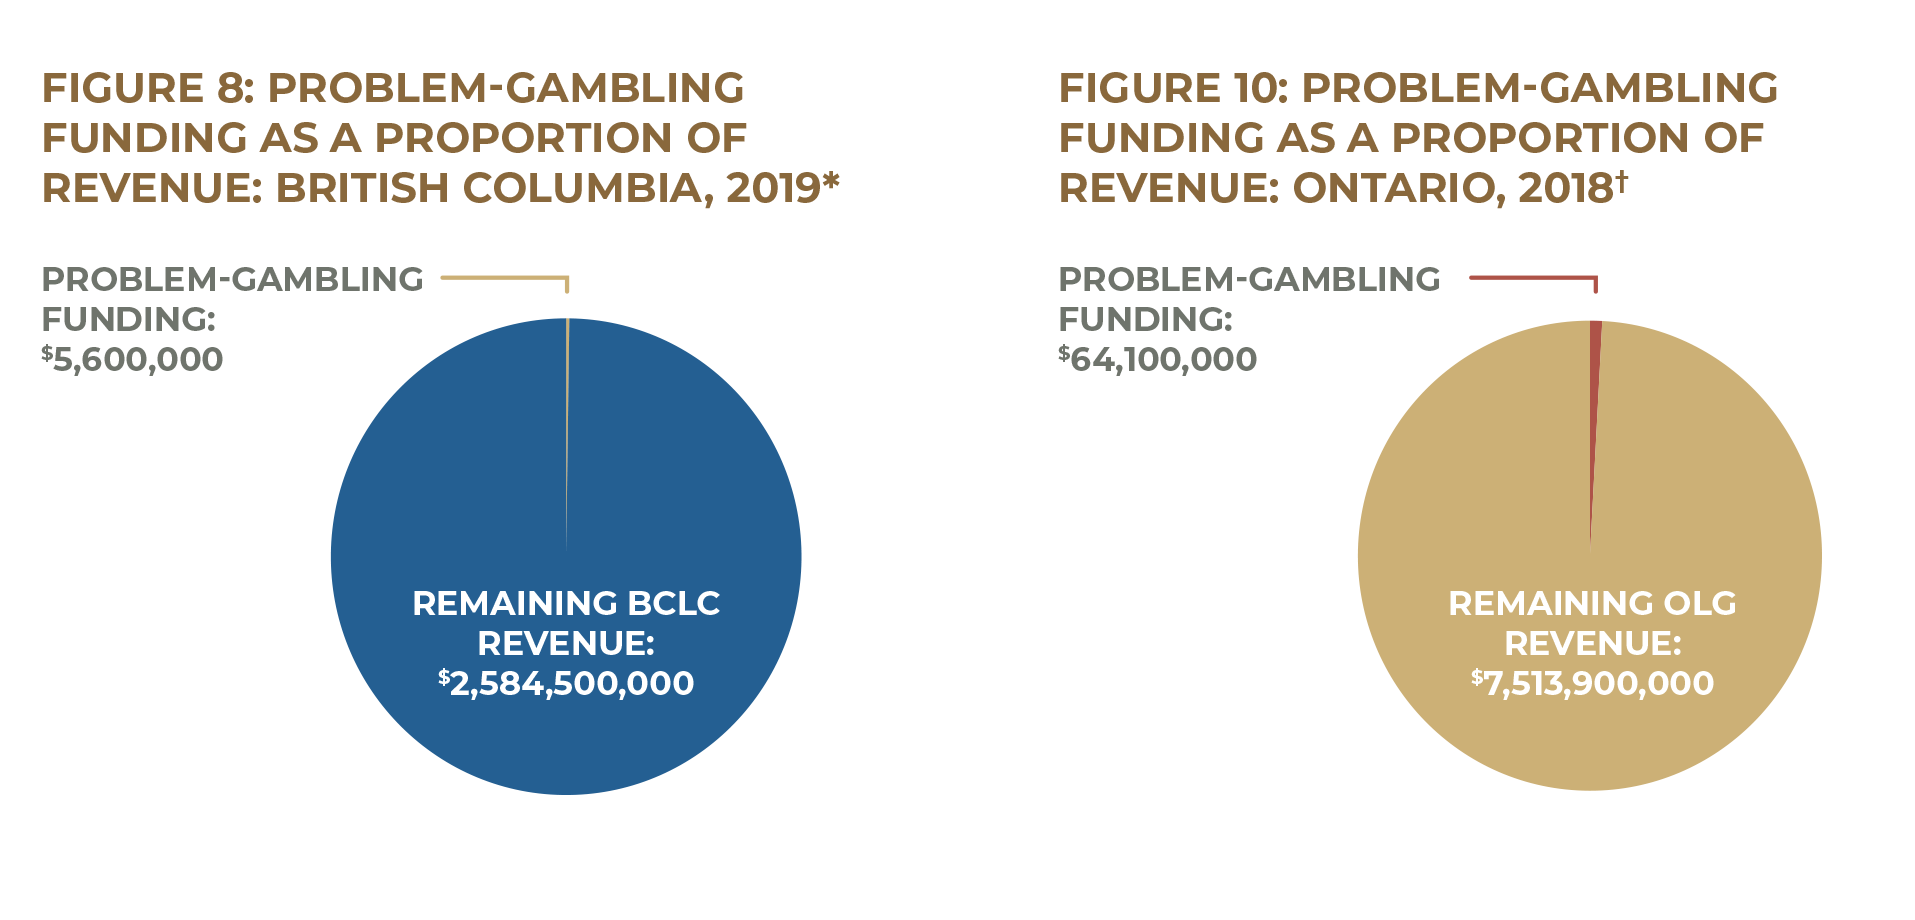
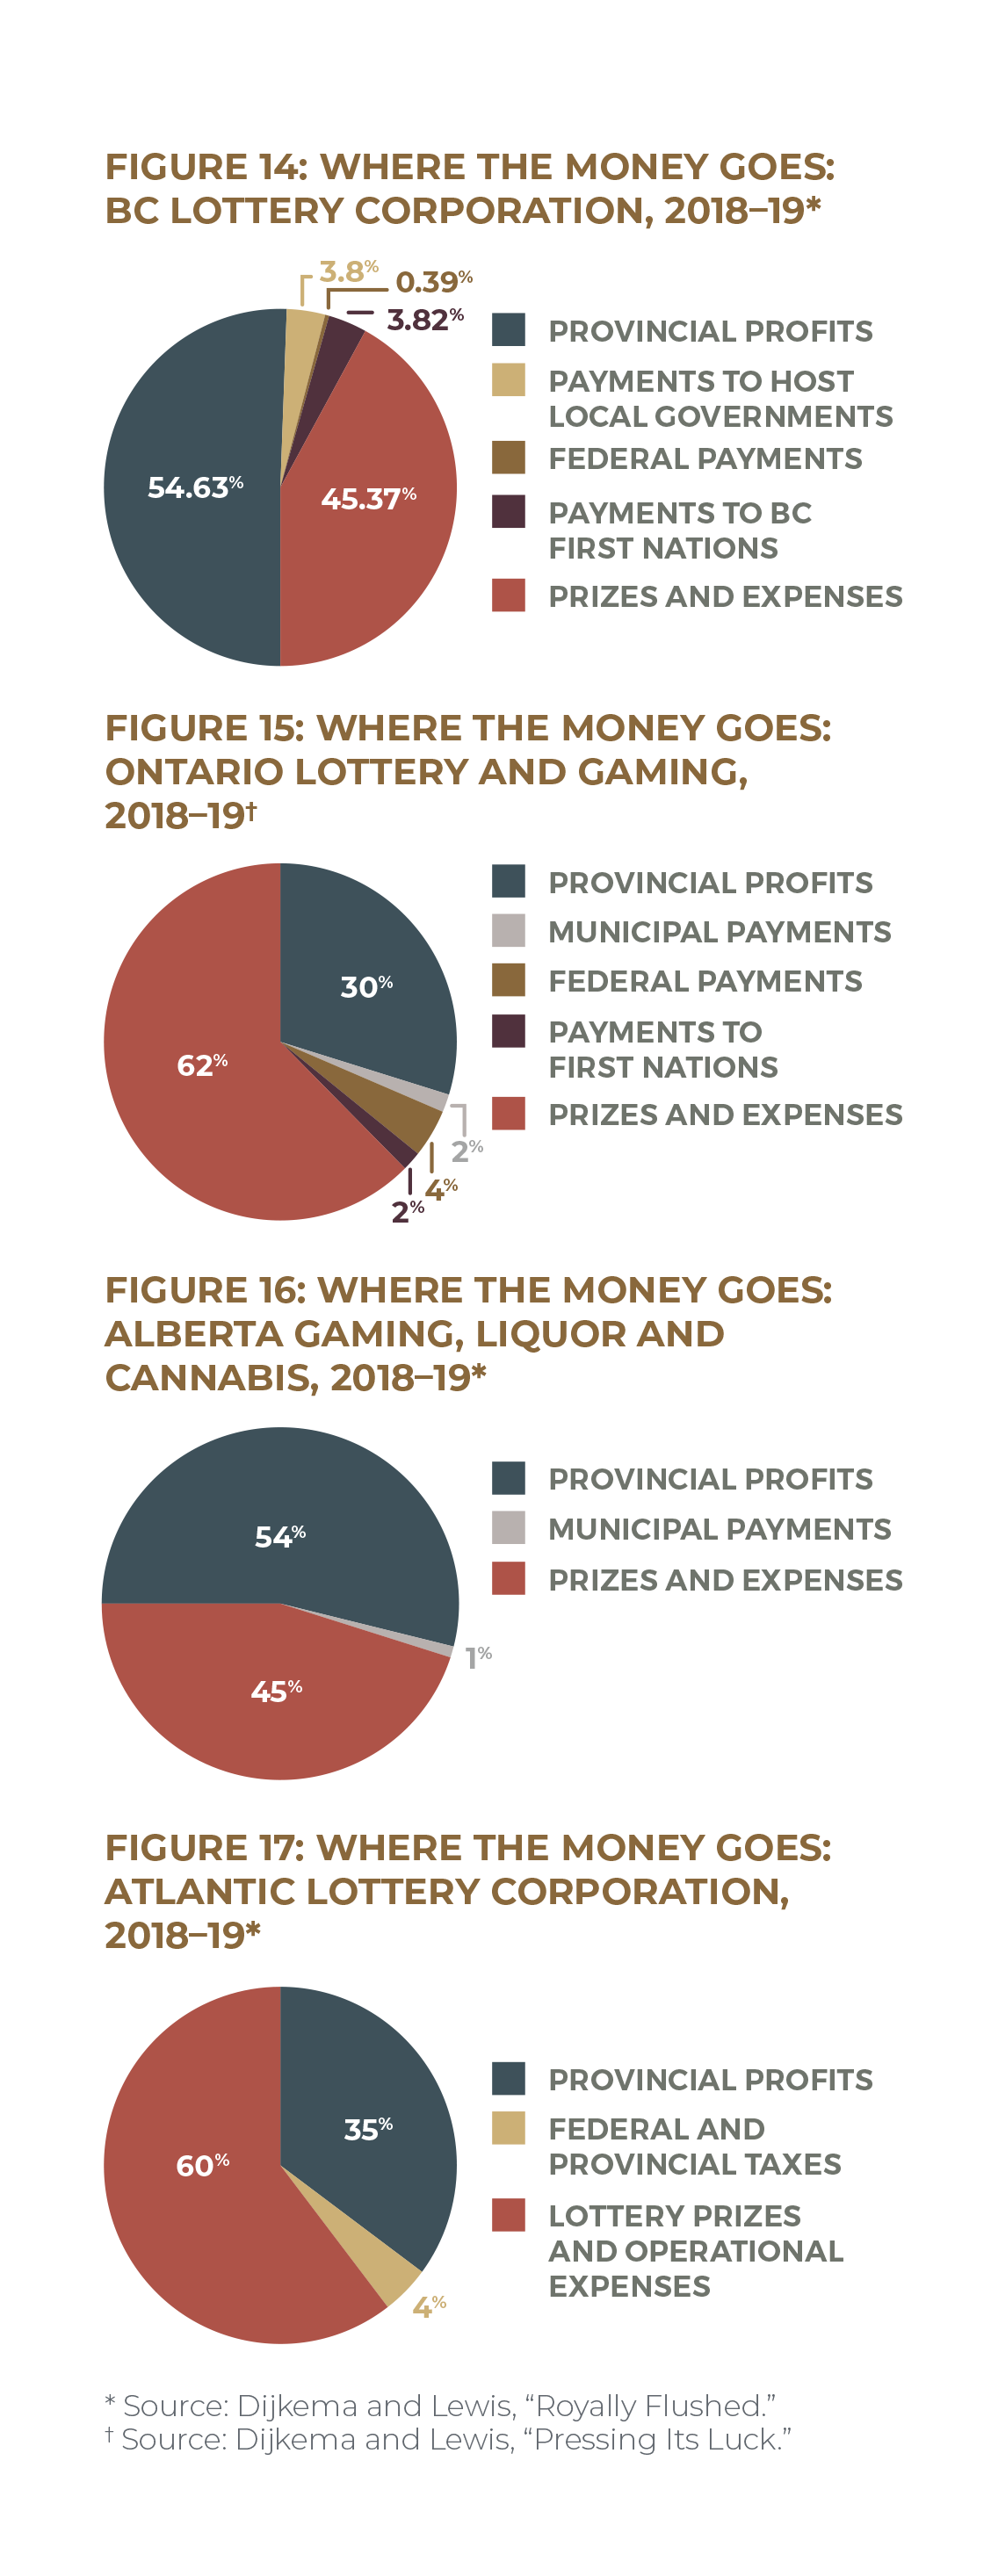
203) Ontario Lottery and Gaming, “OLG Annual Report 2017–18”; see also Dijkema and Lewis, “Pressing Its Luck.” Due to a change in financial reporting practices, these figures were not available for 2018–19 or 2019–20, the most recent reports available at time of writing.
204) British Columbia Lottery Corporation, “2018/19 Annual Service Plan Report”; British Columbia Lottery Corporation, “Where the Money Goes.”
205) Existing gambling research groups in Canada include the following: Gambling Research Exchange, Alberta Gambling Research Institute, the Gambling Research Lab at the University of Waterloo, the Centre for Gambling Research at UBC, and the International Centre for Youth Gambling Problems and High-Risk Behaviours at McGill University. Canadian organizations offering problem-gambling prevention and support include the Responsible Gambling Council, the Canadian Partnership for Responsible Gambling, the Centre for Addiction and Mental Health, provincial gambling helplines, Gamblers Anonymous, Gam-Anon, and GamTalk. Many non-profit organizations offer debt- and credit-counselling services, such as Credit Canada, Christians Against Poverty, the Ontario Association of Credit Counselling Services, Credit Counselling Canada, and the Credit Counselling Society.
206) Ipsos MORI, “Final Synthesis Report”; Bouguettaya et al., “The Relationship Between Gambling Advertising and Gambling Attitudes, Intentions and Behaviours.”
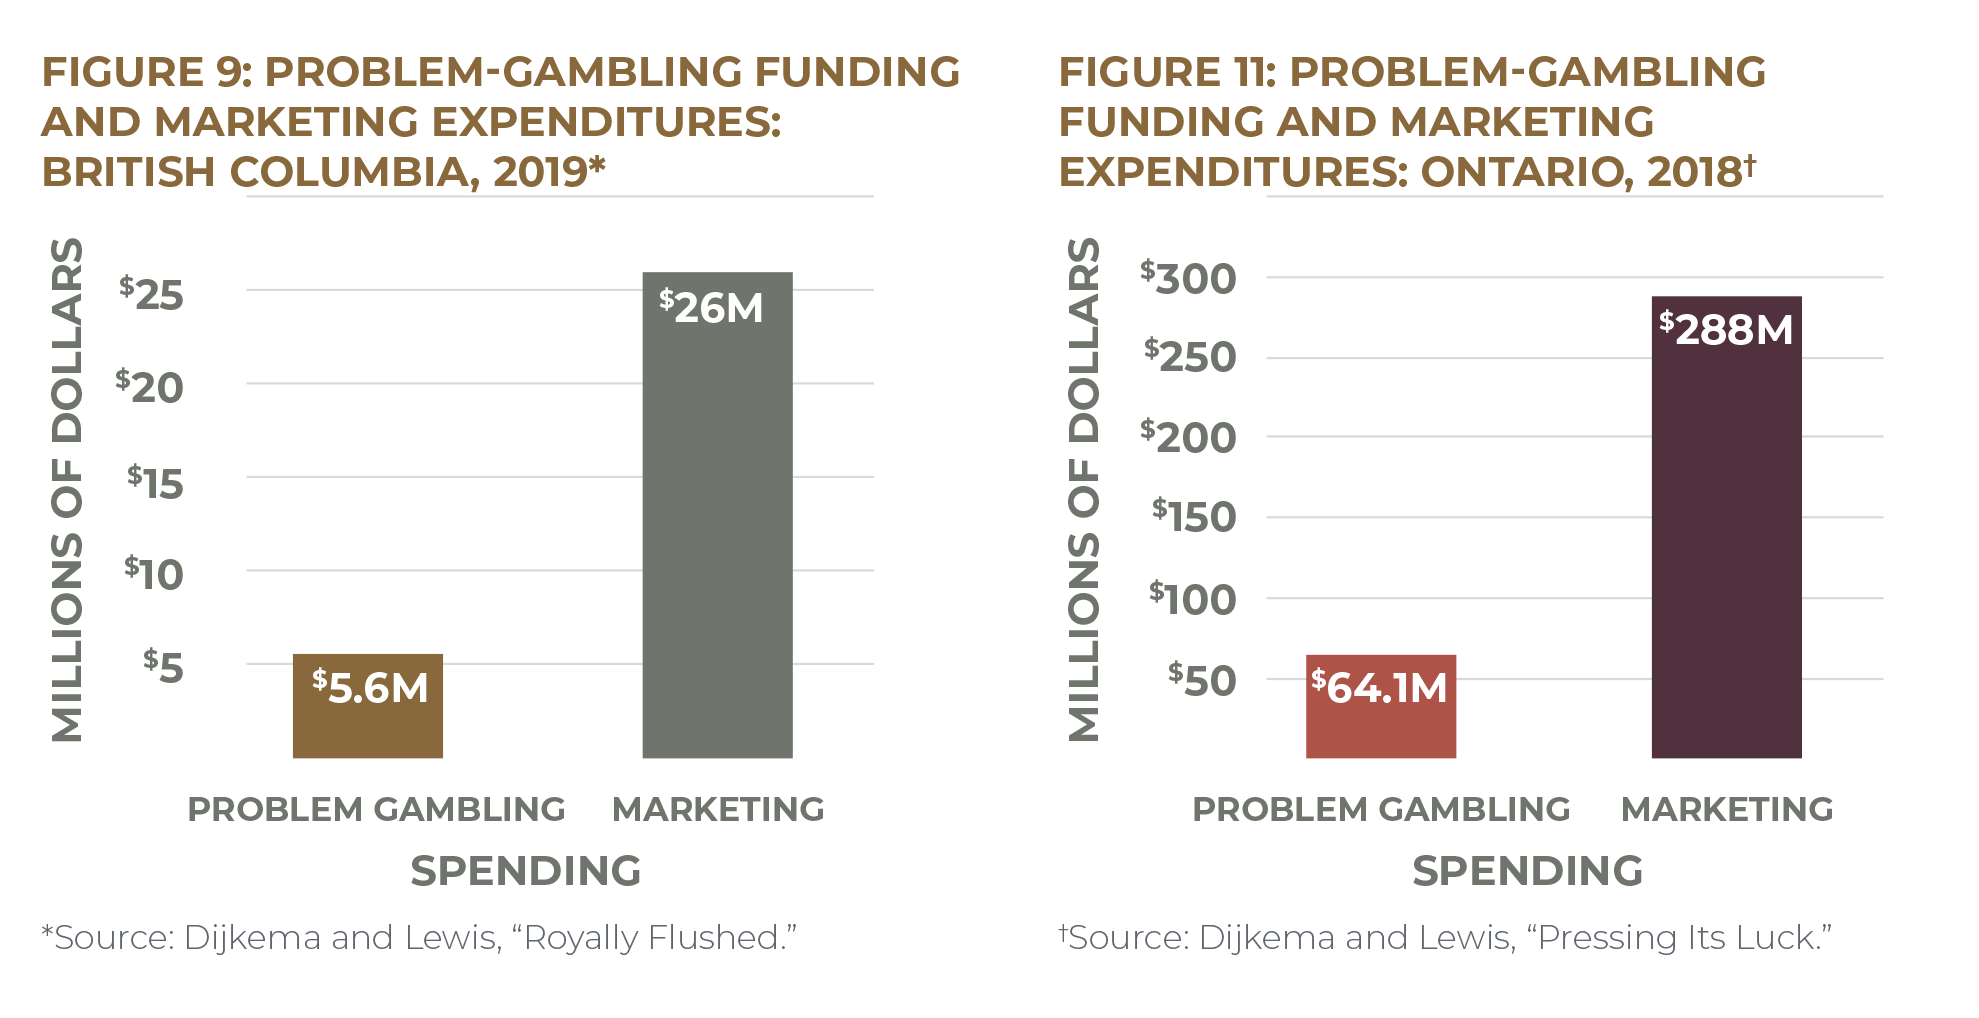
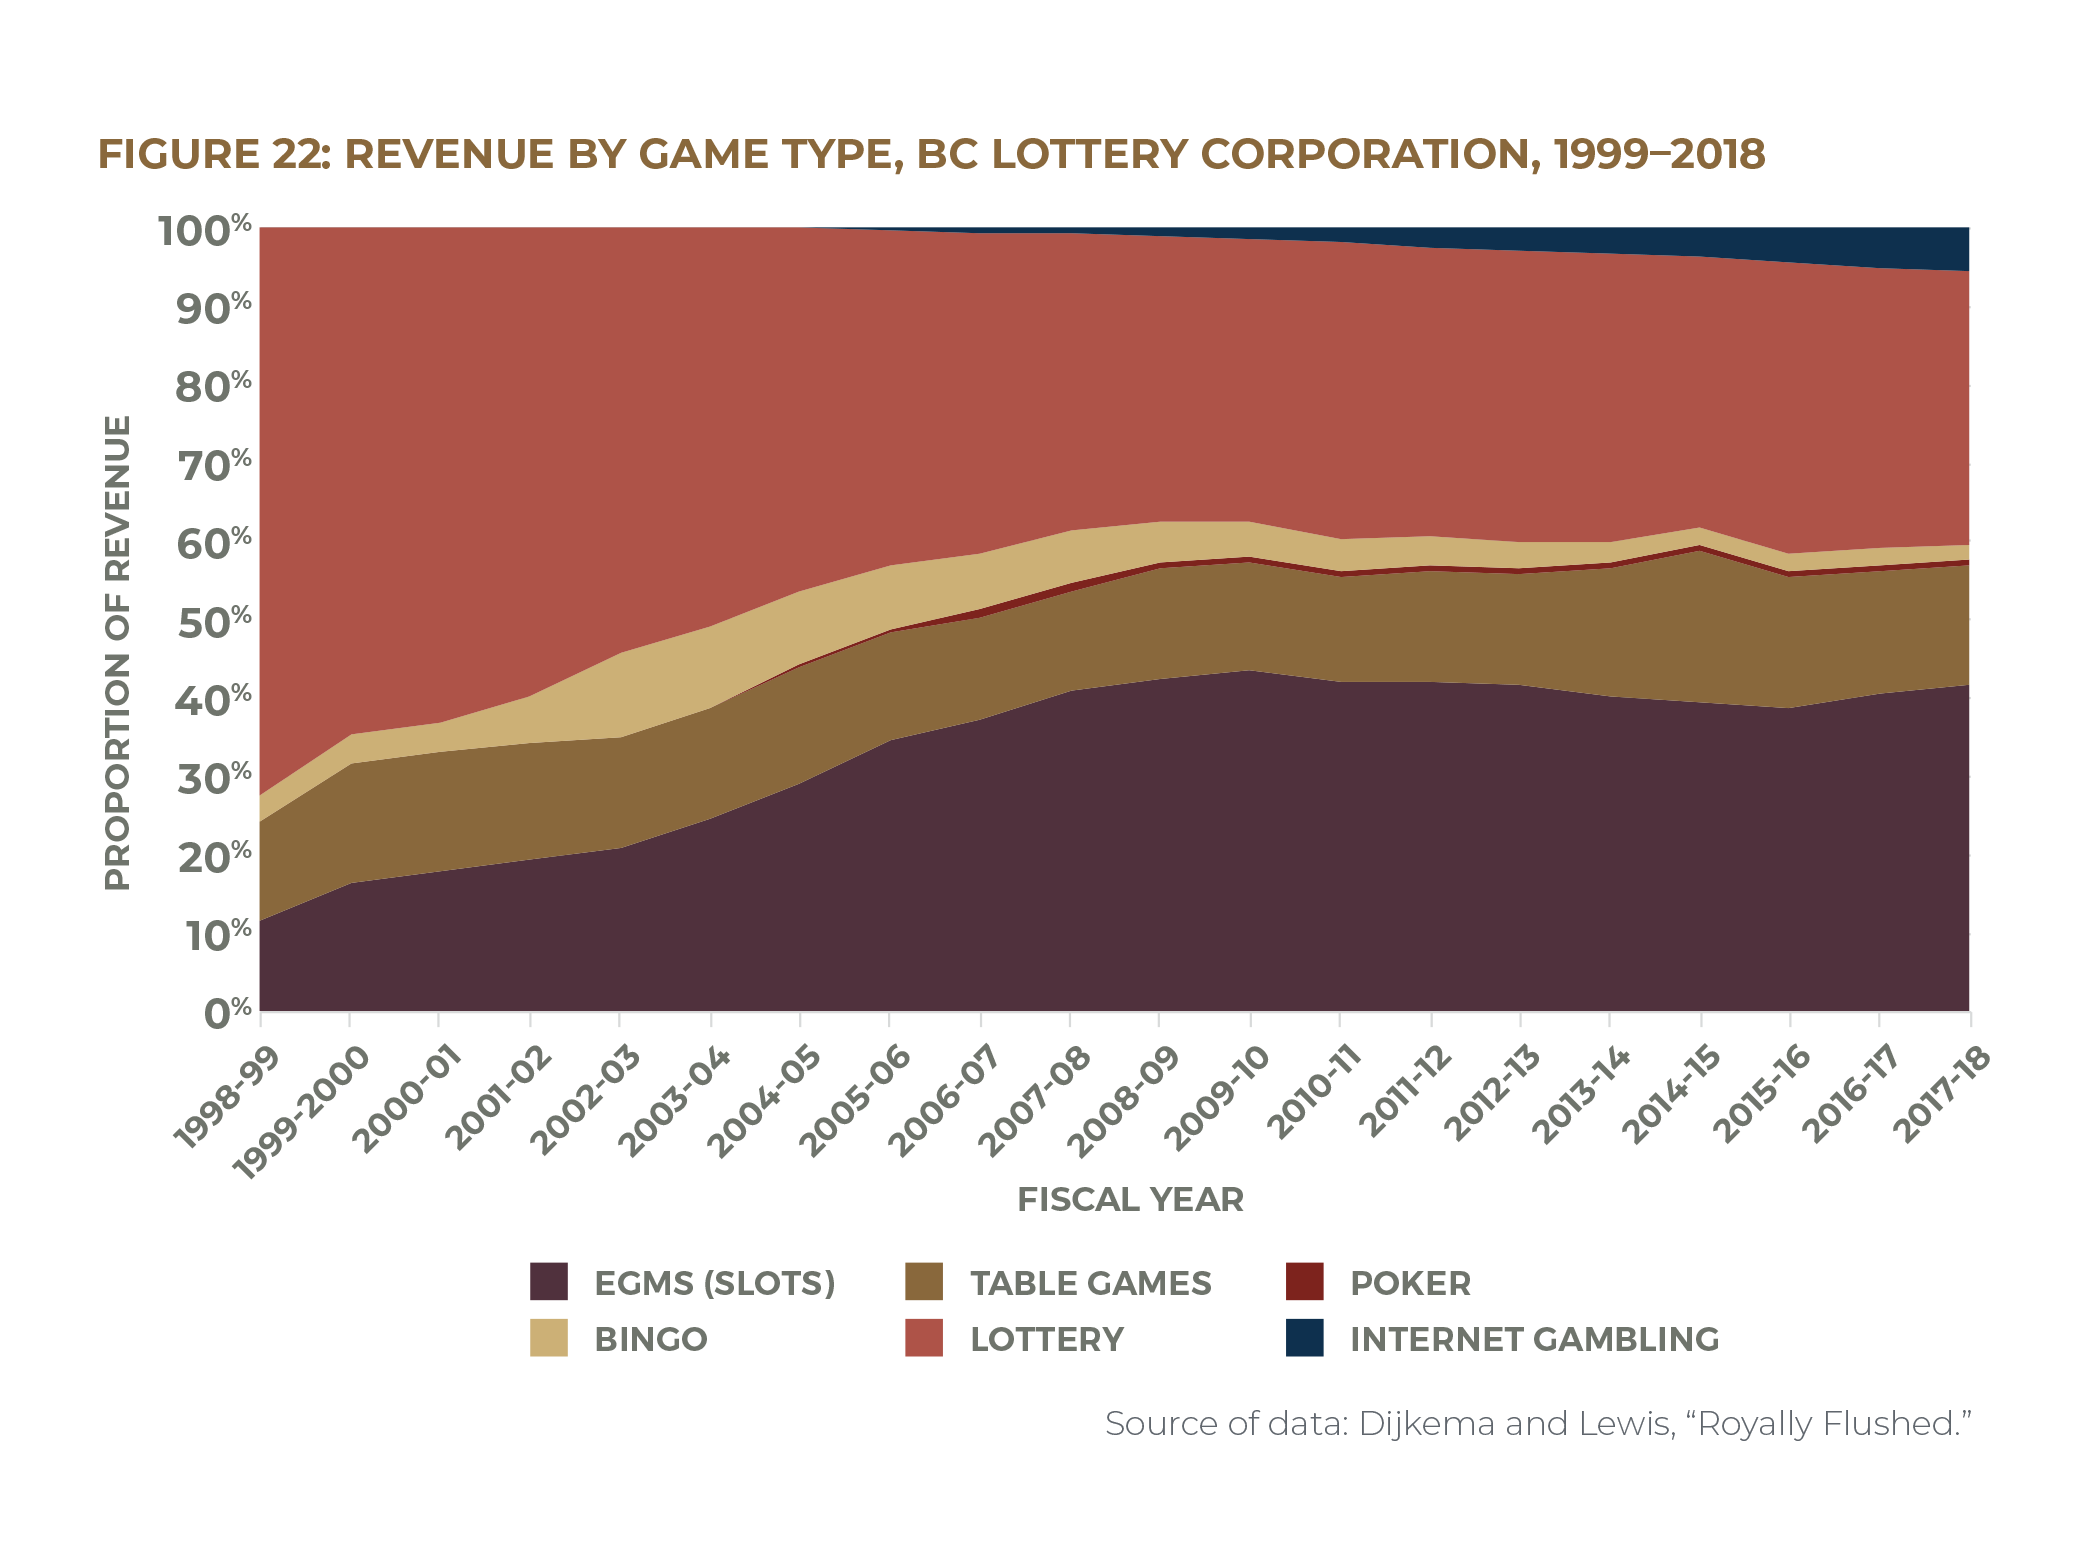
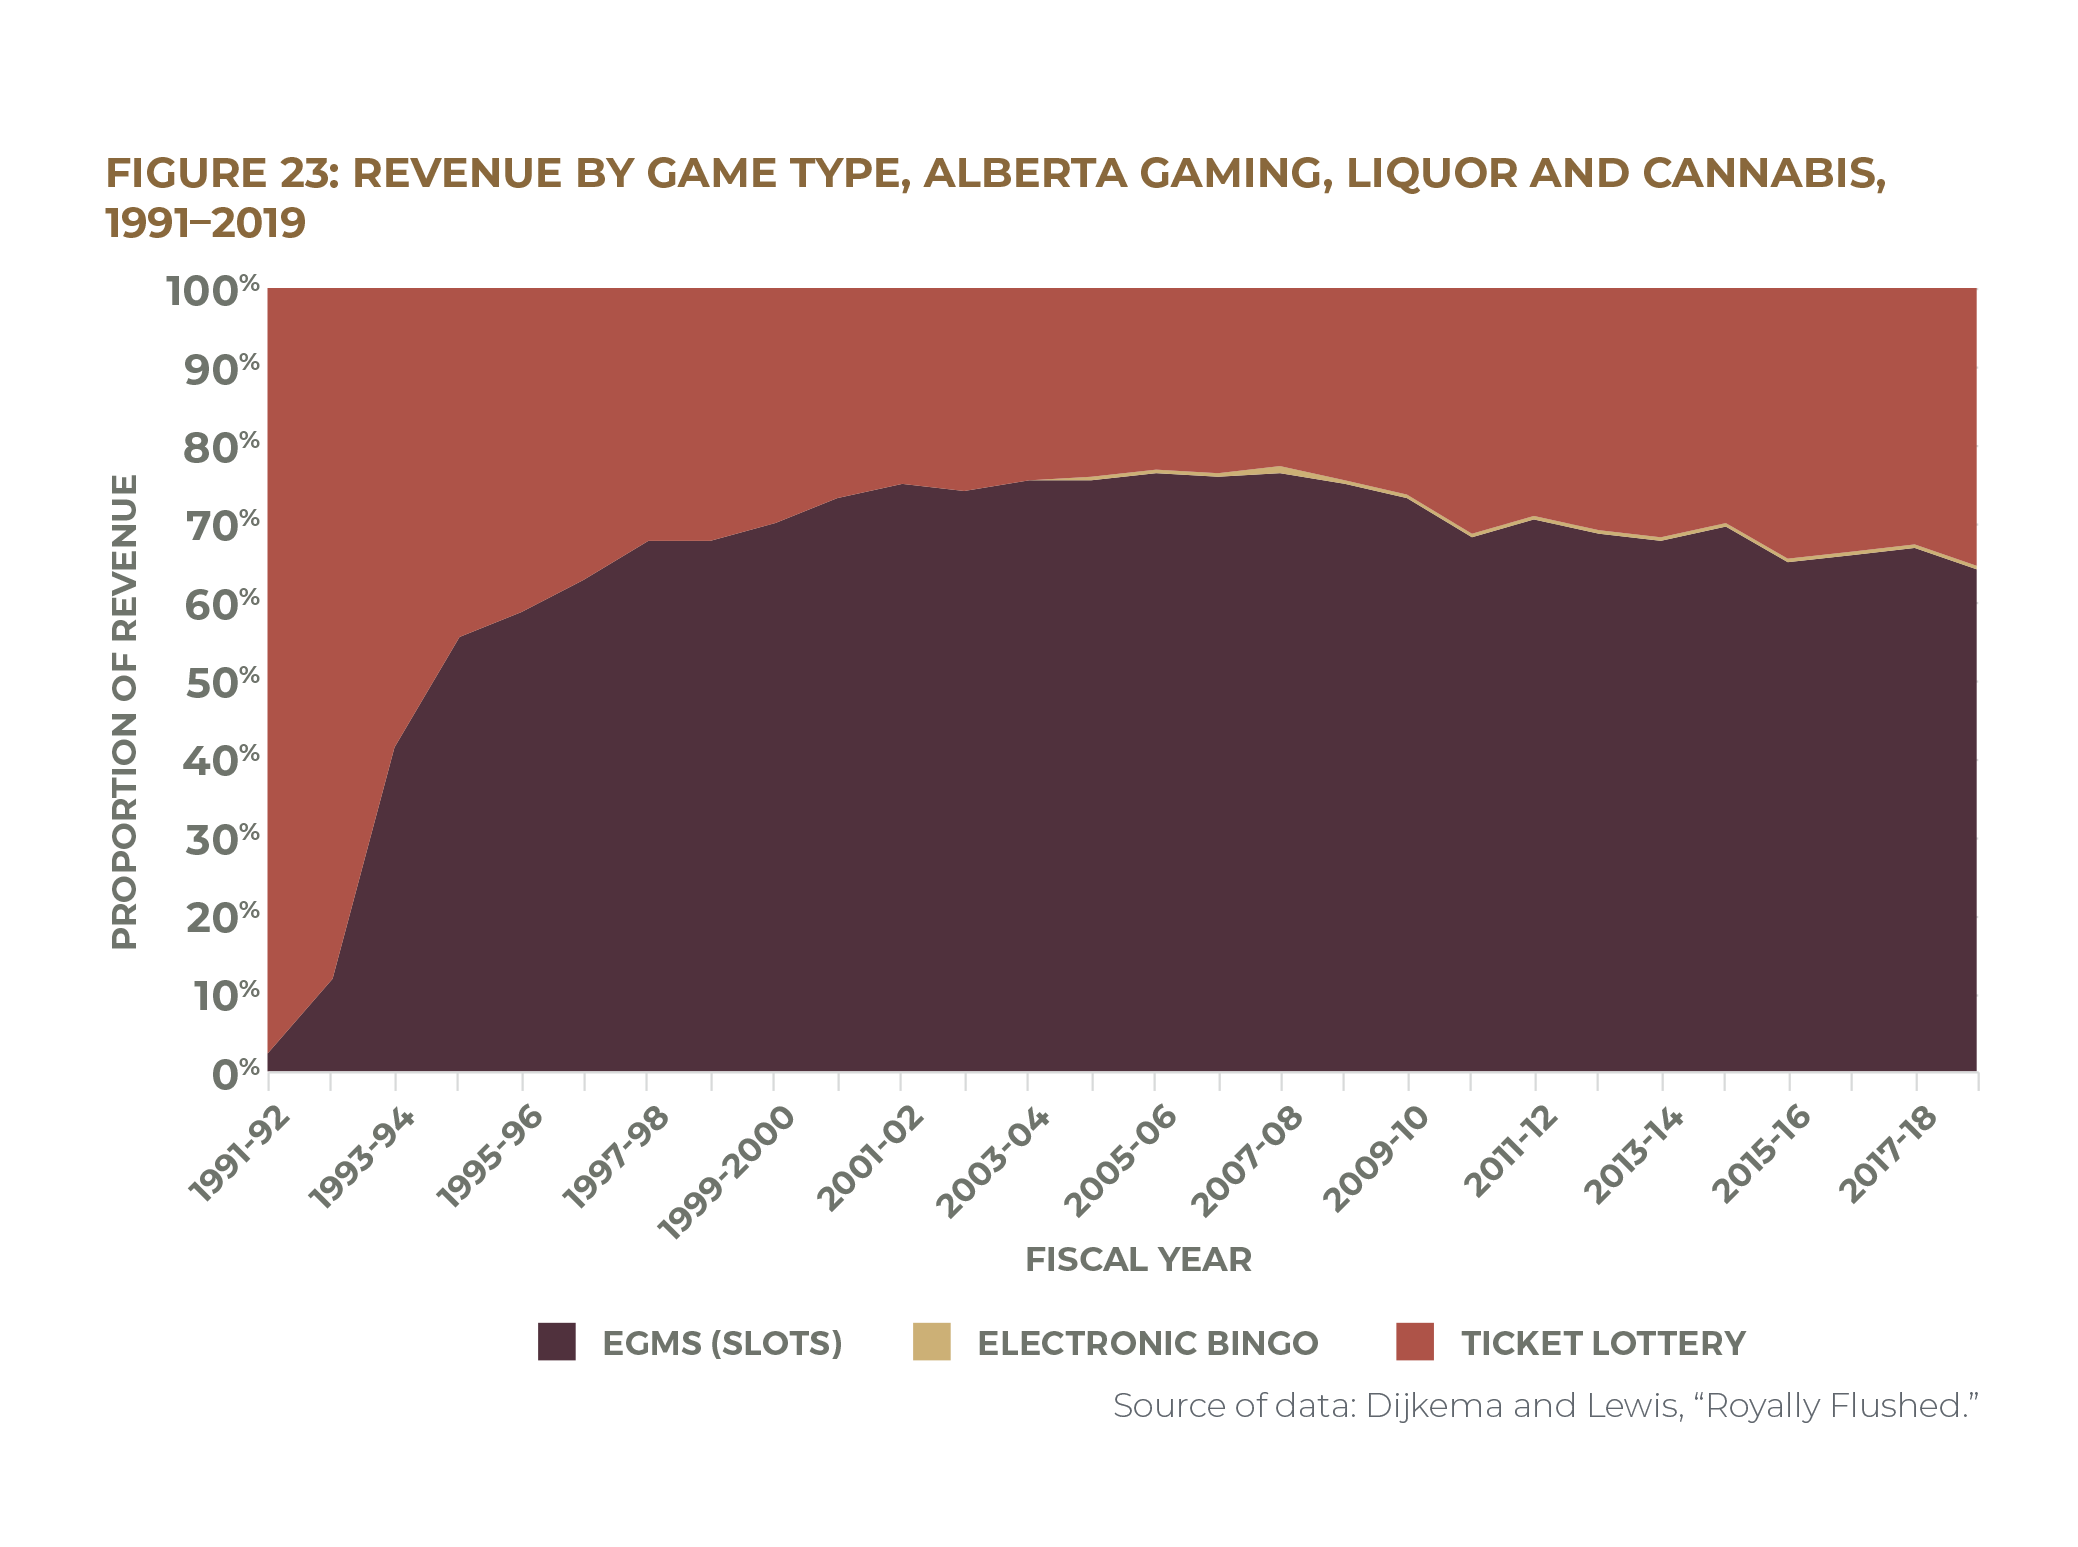
207) Dijkema and Lewis, “Pressing Its Luck”; see also Dijkema and Lewis, Royally Flushed.
208) Henriksson and Lipsey, “Should Provinces Expand Gambling?”
209) Marionneau and Nikkinen, “Does Gambling Harm or Benefit Other Industries?”
210) For example, Williams, Belanger, and Arthur, “Gambling in Alberta,” 93–94, examine Alberta tourism data and find that out-of-province visitors represent only a tiny proportion of patronage and revenue at Alberta casinos. As such, “almost all Albertan gambling revenue dollars represents money spent by Albertans.” In addition, the typical casino in Alberta derives nearly half (46 percent) of its revenue from people who live within five kilometres of it and almost three-quarters (73 percent) of its revenue from people who live within twenty kilometres. See also Williams, Rehm, and Stevens, “The Social and Economic Impacts of Gambling,” 38–41.
211) Ontario Lottery and Gaming, “Annual Report 2017–18,” 30. Rated US play figures represent “theoretical win contributed by U.S. carded patrons as a percentage of theoretical win contributed by all carded patrons. Theoretical win is based on probability theory, the intended win according to table games rule of play and slots payout schedule” and is not budgeted. Rated US play data were not published in OLG’s 2018–19 or 2019–20 annual reports, so 2017–18 figures are used.
212) Government of Australia, Productivity Commission, “Inquiry Report: Gambling,” 6.40.
213) See, e.g., Baxter, “Why Expanding Casinos in Ontario Is a Big Gamble”; Frank, “Casinos a Lazy Way to Deal with Economic Issues”; see also Institute for American Values, “An American Declaration on Government and Gambling.”
214) See also Dadayan, “Are States Betting on Sin?”; Dadayan, “State Revenues from Gambling.”
215) Williams et al., “Gambling and Problem Gambling in Canada 2018.”
216) Ontario Lottery and Gaming, “Lottery Players Fact Sheet”; see also Jones, “Lotteries Struggle to Attract Millennial Players.”
217) Author’s calculations based on data from British Columbia Lottery Corporation, “2018/19 Annual Service Plan Report”; Alberta Gaming, Liquor and Cannabis Corporation, “Annual Report 2018–19”; Ontario Lottery and Gaming, “Annual Report 2018–19”; ALC, “Annual Report 2018–19.”
218) See Lilley, “OLG Boss Sets the Tone”; Lilley, “OLG Bosses Cash In Big”; Lilley, “OLG Prez on His Way Out.”
219) Alcohol Gaming Commission of Ontario, “Liquor Advertising.”
220) A few exemptions exist for specialty sellers. Ontario, “Rules for Selling Tobacco and Vapour Products”; Ontario, Smoke-Free Ontario Act, 2017, S.O. 2017, c. 26, Sched. 3; Government of Canada, “New Health Labelling for Tobacco Packaging.”
221) See Doughney, “Ethical Blindness, EGMs and Public Policy”; Williams, West, and Simpson, “Prevention of Problem Gambling”; Williams and Wood, “What Proportion of Gambling.”
222) Ontario Lottery and Gaming, “Find a Casino.”
223) Williams, West, and Simpson, “Prevention of Problem Gambling,” 87.
224) Williams, West, and Simpson, “Prevention of Problem Gambling,” 82.
225) Suurvali et al., “Treatment Seeking Among Ontario Problem Gamblers”; Suurvali, Hodgins, and Cunningham, “Motivators for Resolving or Seeking Help for Gambling Problems”; Cunningham, “Little Use of Treatment Among Problem Gamblers”; Rush et al., “Characteristics of People Seeking Help.”
226) Cox et al., “A National Survey of Gambling Problems in Canada.”
227) Rush, Veldhuizen, and Adlaf, “Mapping the Prevalence of Problem Gambling”; Pearce et al., “A National Study of Neighbourhood Access”; Welte et al., “The Relationship of Ecological and Geographic Factors to Gambling Behaviour and Pathology”; Vasiliadis et al., “Physical Accessibility of Gaming Opportunity”; Tong and Chim, “The Relationship Between Casino Proximity and Problem Gambling”; Welte et al., “The Relationship Between Distance from Gambling Venues.” Some studies have found that the relationship between problem gambling and proximity to gambling venues weakens with time—problem gambling may spike when a casino is introduced to the community but may decline somewhat after several years.
228) Gambling Research Exchange Ontario, “Gambling from a Public Health Perspective.”
229) Williams, West, and Simpson, “Prevention of Problem Gambling,” 87.
230) See Toronto Public Health, “Position Statement: Gambling and Health”; Williams, West, and Simpson, “Prevention of Problem Gambling,” 90–91.
231) Williams, West, and Simpson, “Prevention of Problem Gambling,” 86.
232) Livingstone, “How Electronic Gambling Machines Work,” 2; see also Harrigan et al., “Effect and Regulation”; Harrigan, “Gap Analysis”; C. Jensen et al., “Misinterpreting ‘Winning’ in Multiline Slot Machine Games.”
233) Doiron, “Gambling and Problem Gambling in Prince Edward Island.”
234) Williams, Belanger, and Arthur, “Gambling in Alberta.”
235) Dieleman et al., “Committee to Study the Problem of Gambling,” 265; see also Moscovich, “Gambling with Our (Kids’) Futures,” 19.
236) Dieleman et al., “Committee to Study the Problem of Gambling,” 265; see also Pontifical Council for Justice and Peace, Compendium of the Social Doctrine of the Church.
237) MacNeil et al., “The False Eden of Gambling.”