CITATIONS
1) OLG, “Home page.”
2) Robinson, History of the Law of Gaming, 2.
3) See Belanger, Gambling with the Future, 36.
4) Belanger, Gambling with the Future, 5
5) Robinson, History of the Law of Gaming, 11–15.
6) “At one point all thirteen colonies of the original United States employed lottery schemes and encouraged their citizens to play as a civic responsibility” (Belanger, Gambling with the Future, 42). See also Robinson, History of the Law of Gaming, 13–15.
7) Robinson, History of the Law of Gaming, 32-33
8) Seelig and Seelig, “‘Place Your Bets!’” 92; Smith, “Nature and Scope,” 706
9) Barmaki, “Gambling as a Social Problem,” 49; Robinson, History of the Law of Gaming, 45; Morton, At Odds, 7–8
10) Morton, At Odds, 8–11. In 1856 the Province of Canada made it illegal to hold draws or sell lottery tickets, but the Catholic Church
pressured the government of Canada East to loosen the restrictions and allow charity lotteries offering non-cash prizes. Barmaki,
“Gambling as a Social Problem,” 49.
11) Campbell, Hartnagel, and Smith, “Legalization of Gambling in Canada.”
12) Campbell, Hartnagel, and Smith, “Legalization of Gambling in Canada,” 13–14; Robinson, History of the Law of Gaming, iii; Smith,
“Gambling in Canada,” 707.
13) Morton, At Odds, 12.
14) Campbell, Hartnagel, and Smith, The Legalization of Gambling in Canada, 14; Morton, At Odds, 11.
15) Campbell, Hartnagel, and Smith, “Legalization of Gambling in Canada,” 17–18.
16) Cosgrave and Klassen, Casino State, 122.
17) Campbell, Hartnagel, and Smith, “Legalization of Gambling in Canada,” 15–21. The federal-provincial agreement is dated 1979, with funds indexed to inflation from the same year. In 2018–19, the Canadian federal government’s proceeds from lotteries were just under $75.9 million. Government of Canada, Public Accounts of Canada 2019, 2:151.
18) Cosgrave and Klassen, Casino State, 122-3.
19) Ontario, “C. 126 The Ontario Lottery Corporation Act, 1974”; see also Dijkema, “Government Addictions.”
20) Ontario Legislative Assembly, Hansard, 31st Parl., 4th Sess., November 18, 1980; see also Dijkema, “Government Addictions.”
21) Ontario, “Ontario Lottery Corporation Act, R.S.O. 1990”; OLG, “Our History: 1989–1975.”
22) Ontario, “Ontario Lottery Corporation Act, R.S.O. 1990”; OLG, “Our History: 1999–1990.”
23) Ontario Legislative Assembly, Hansard, 34th Parl., 2nd Sess., May 29, 1990, at 1520
24) Ontario Legislative Assembly, Hansard, 34th Parl., 2nd Sess. June 26, 1990, at 1550.
25) Ontario Legislative Assembly, Hansard, 34th Parl., 1st Sess., February 28, 1989, at 1600.
26) Ontario, “Ontario Casino Corporation Act, 1993.”
27) OLG, “Our History: 2004–2000”; OLG, “Our History: 2009–2005.”
28) Ontario, “Ontario Lottery and Gaming Corporation Act, S.O. 1999.”
29) Marin, “Game of Trust,” 11.
30) Radwanski, “McGuinty Can’t Afford Misgivings”; OLG, “Modernizing Lottery and Gaming in Ontario.”
31) Alberta Legislative Assembly, Hansard, 30th Leg., 1st Sess., October 29, 2019, at 2064.
32) Alberta Legislative Assembly, Bill 20.
33) OLG, “Modernizing Lottery and Gaming in Ontario,” 2.
34) OLG, “Annual Report 2018–19.”
35) OLG, “Annual Report 2018–19,” Public Accounts of Ontario 1994–95.
36) OLG, “Annual Report 2018–19.”
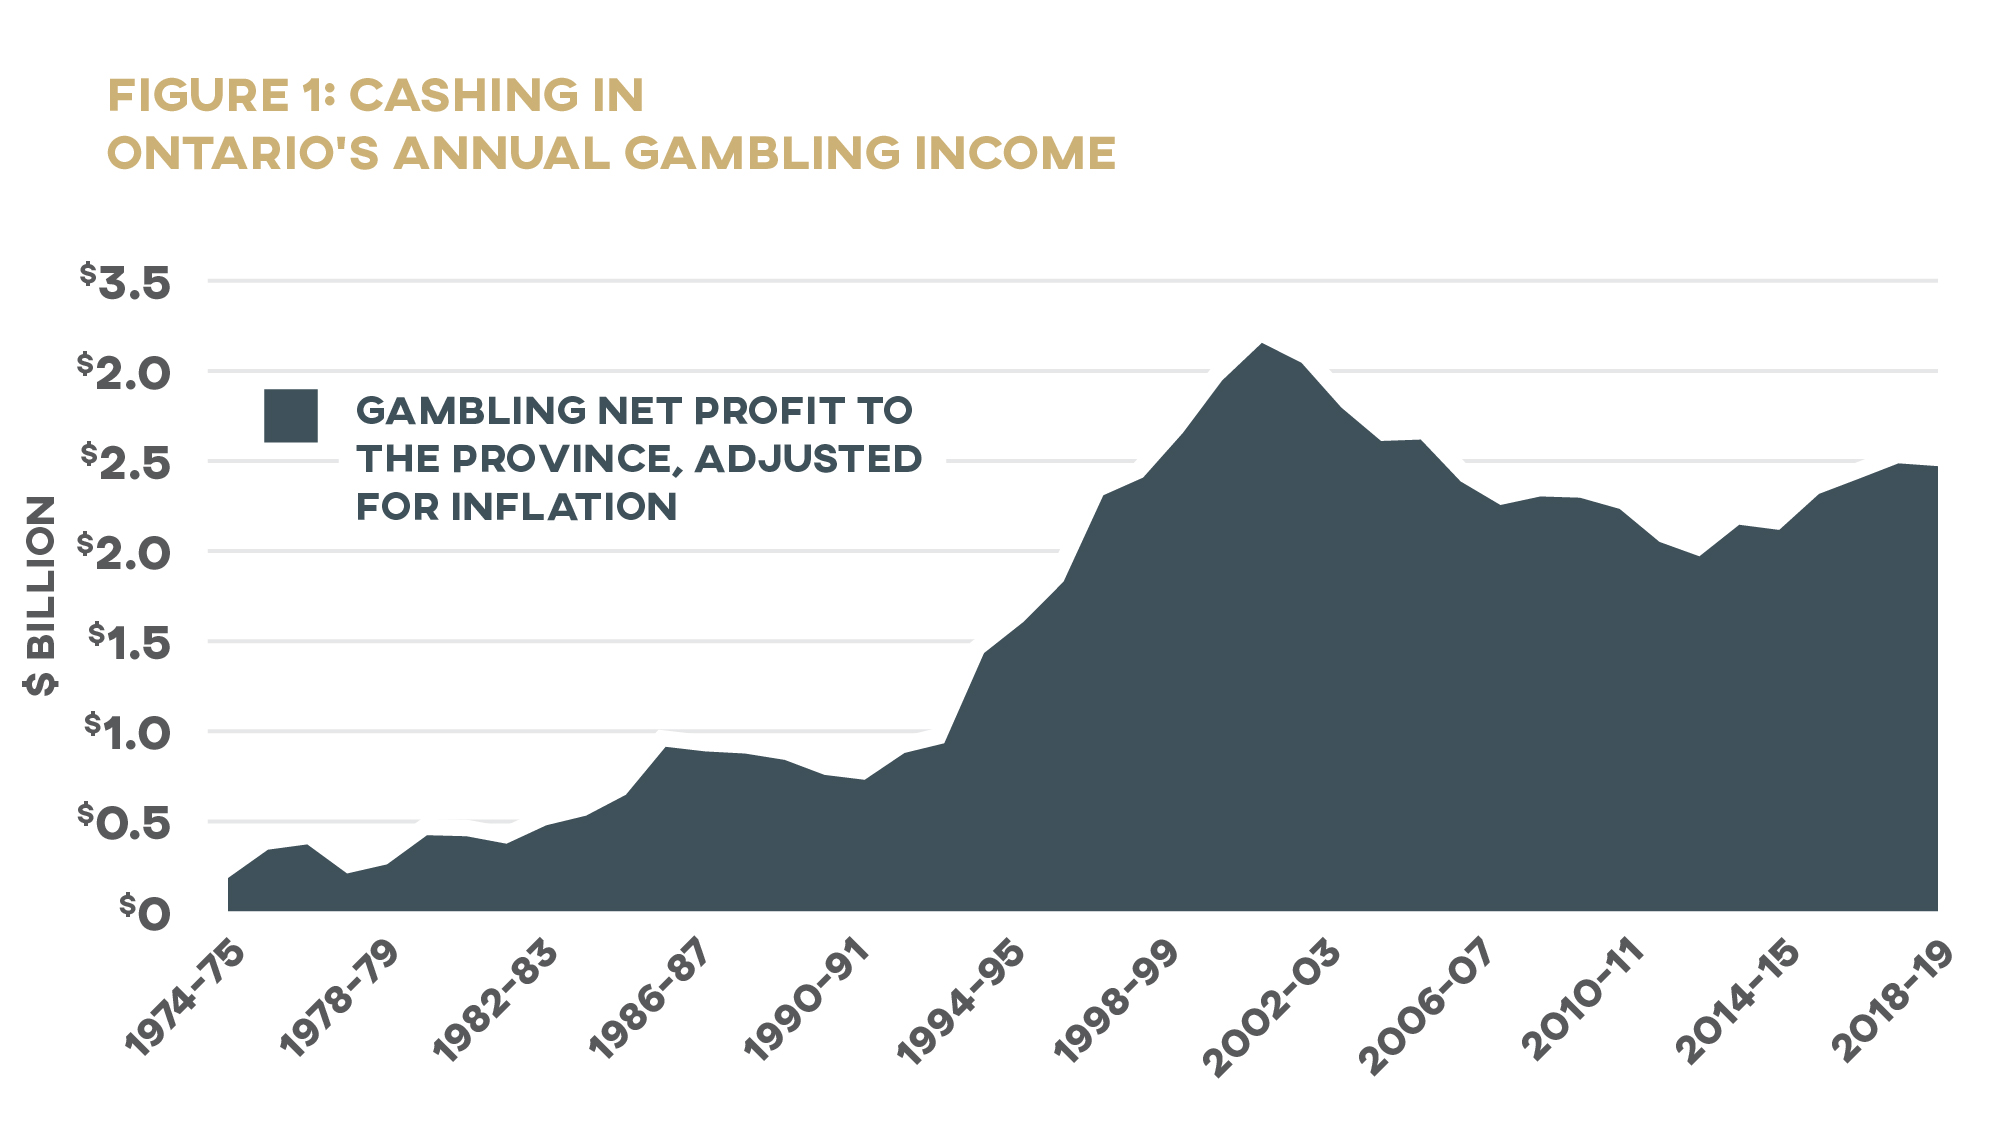
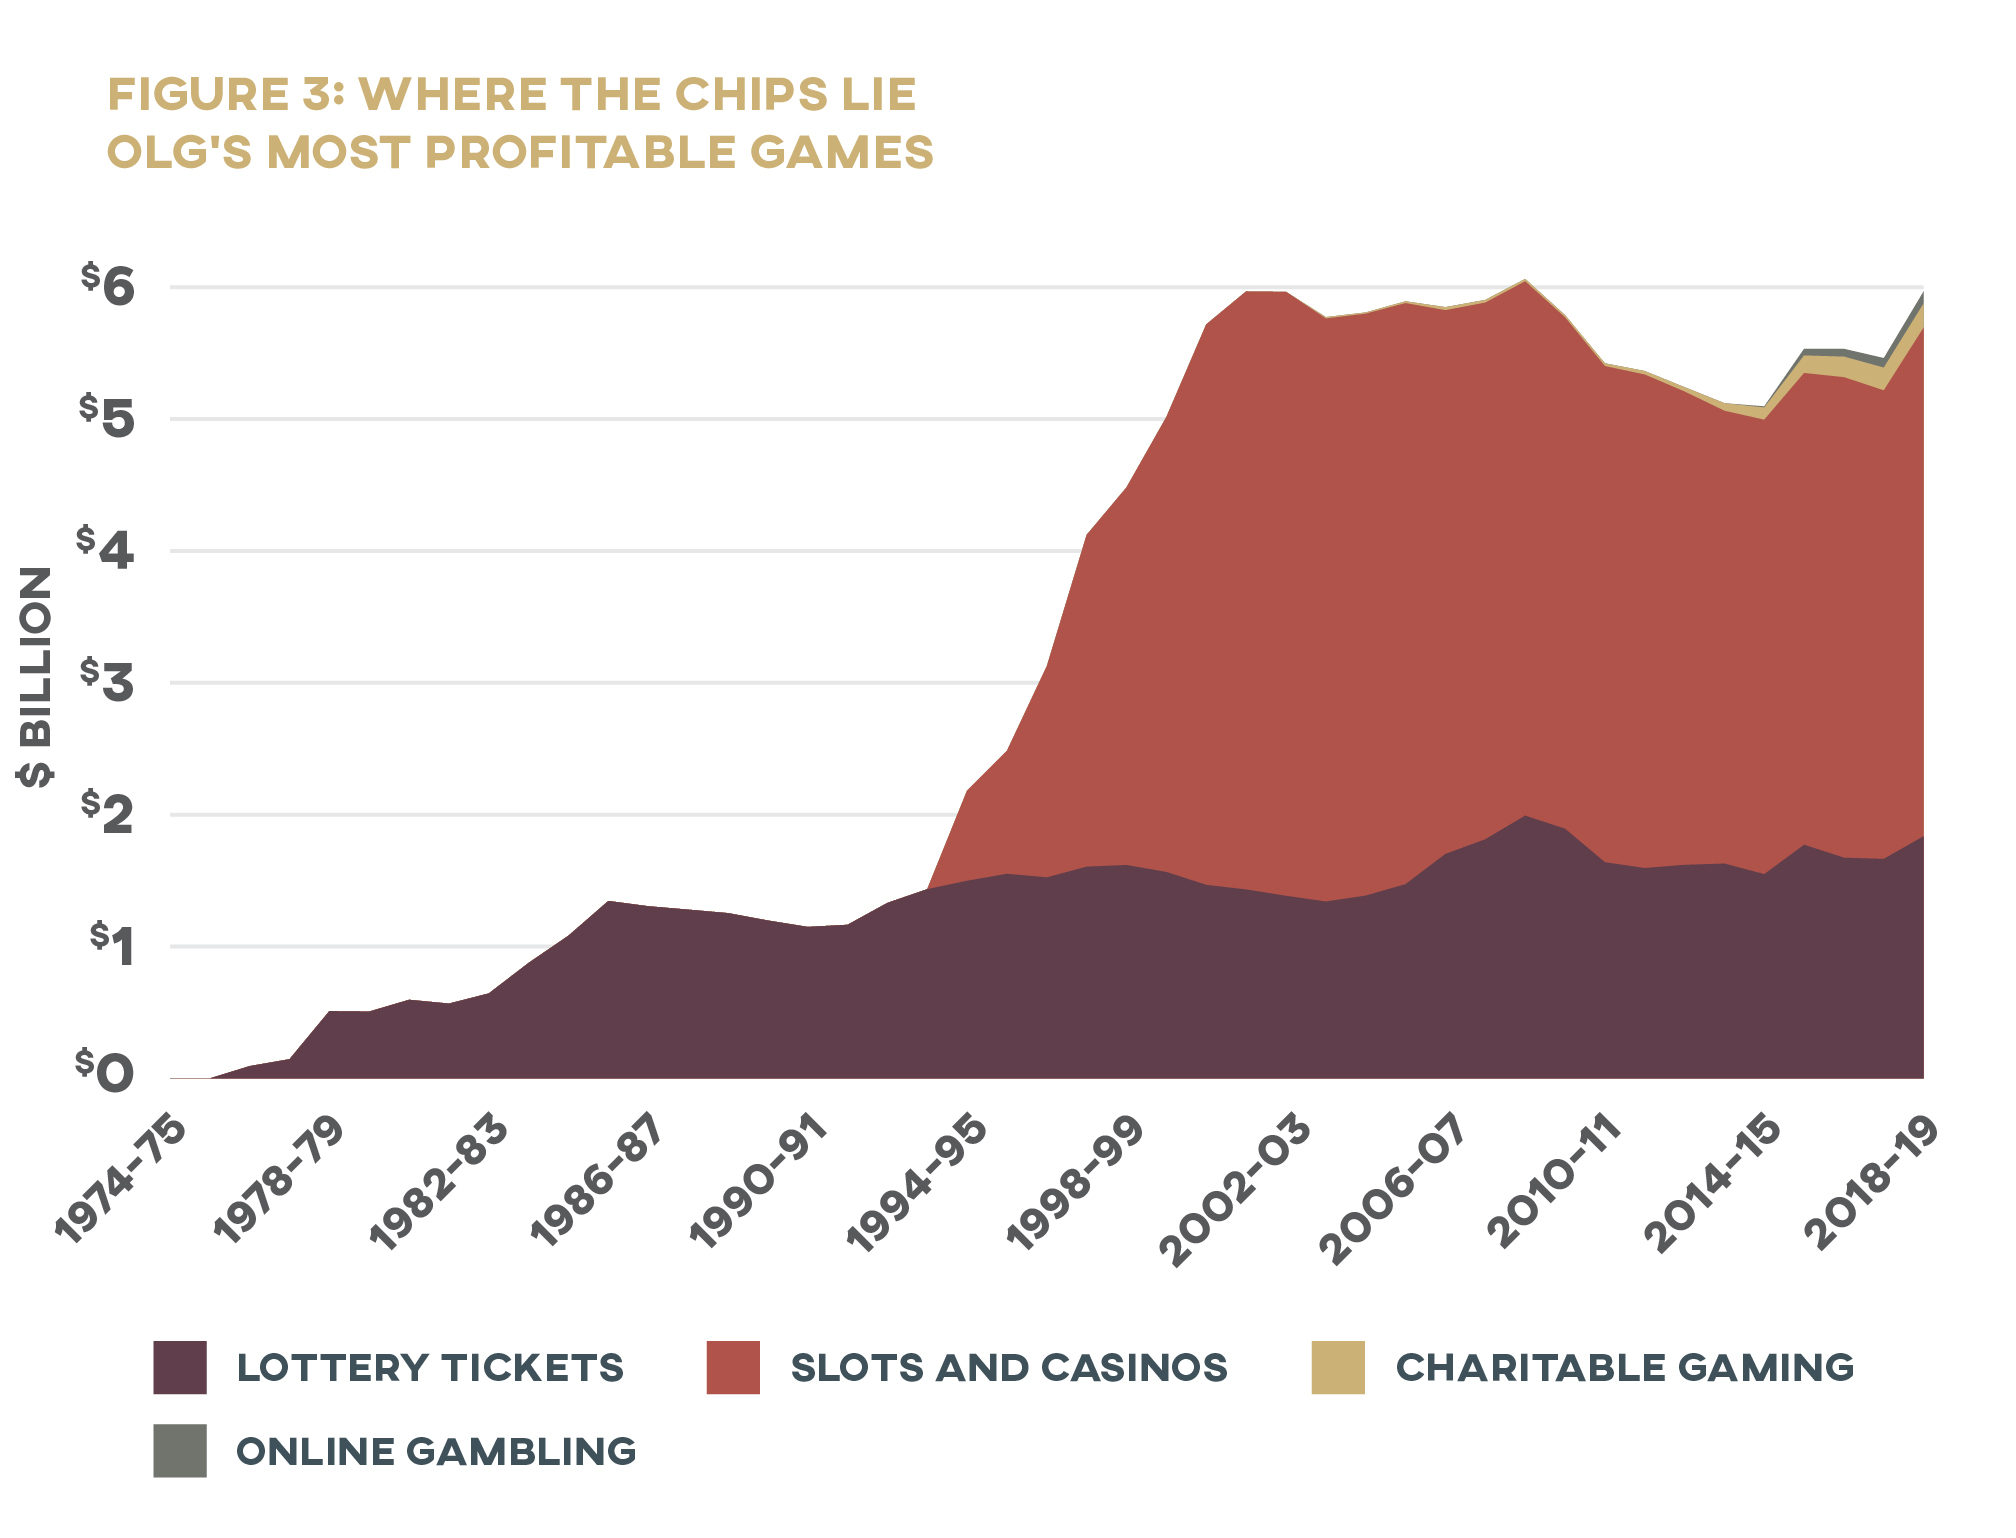
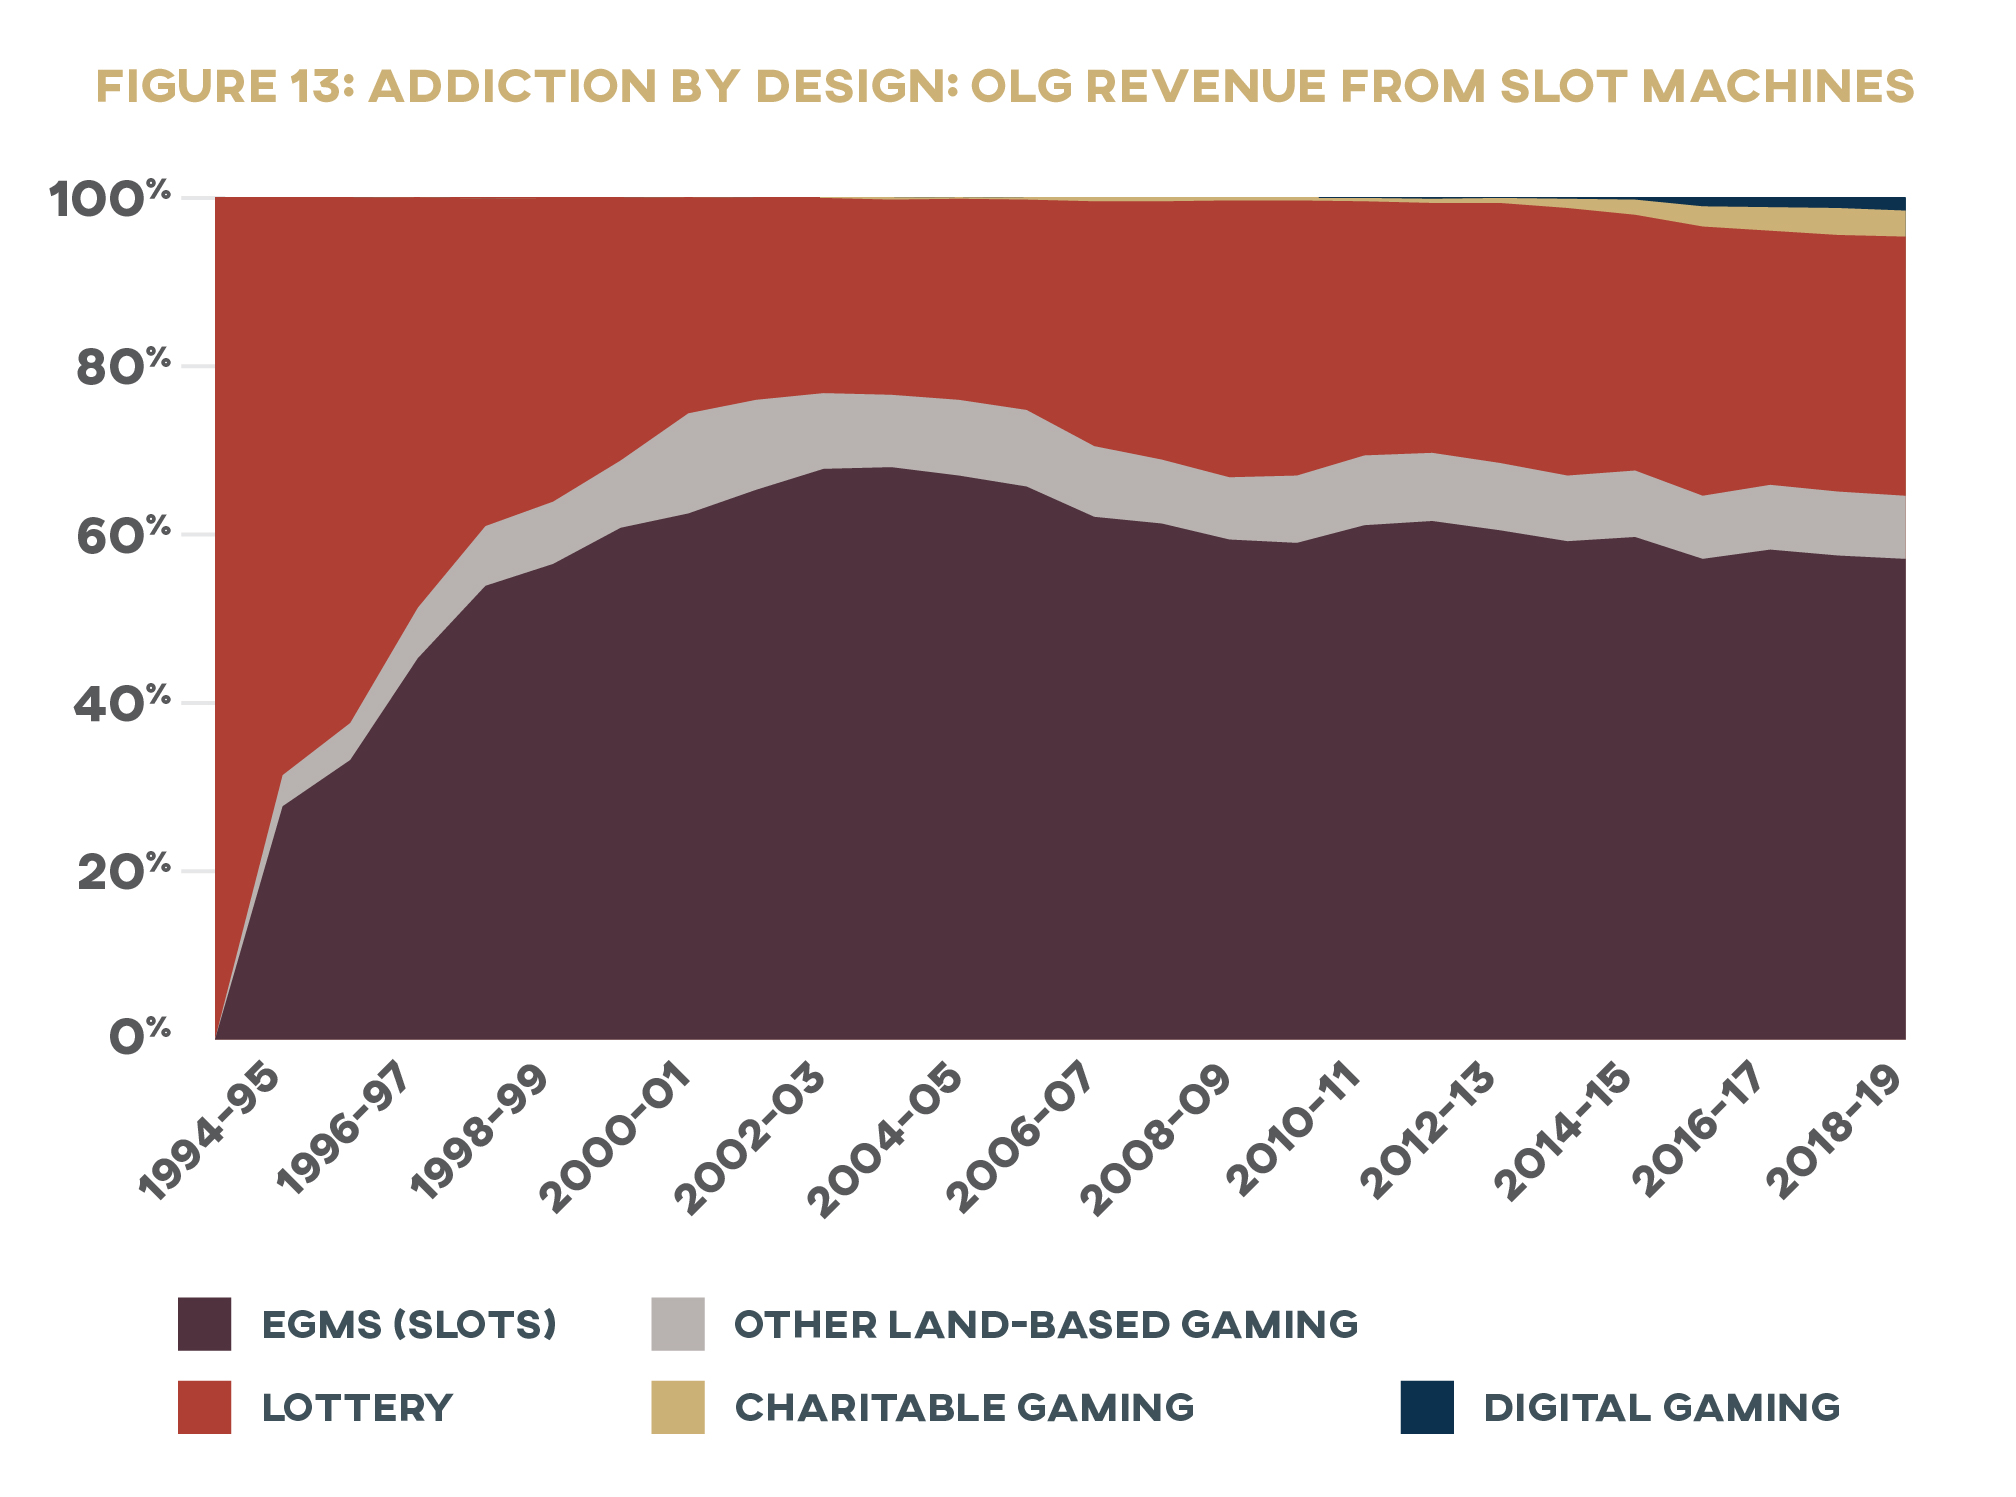
37) OLG annual net win by game type, adjusted for inflation. Figures taken from OLG annual reports and Ontario public accounts
38) OLG, “Annual Report 2018–19.”
39) OLG, “Annual Report 2017–18,” 23.
40) Authors’ calculations based on data from Ontario, “Public Accounts of Ontario: Past Editions.”
41) Robson, “Game Goes On.”
42) The Ontario government reported $140.7 billion in total revenue and a $2.4 billion annual deficit for the 2016–17 fiscal year (both figures restated actual), while OLG reported $2.4 billion in net profit to the province. OLG, “OLG Annual Report 2016–17”; Ontario Treasury Board Secretariat, Public Accounts of Ontario 2017–18.
43) Wiebe, Mun, and Kauffman, Gambling and
Problem Gambling in Ontario 2005, 22; Marshall, “Gambling 2011,” 6.
44) Williams and Volberg, “Gambling and Problem Gambling in Ontario,” 54–55; Wiebe, Single, and Falkowski-Ham, “Measuring Gambling,” 18.
45) Marshall, “Gambling 2011,” 6; MacDonald, McMullan, and Perrier, “Gambling Households in Canada,” 194; McCready et al., “Gambling and Seniors,” 57.
46) Marshall, “Gambling 2011,” 6.
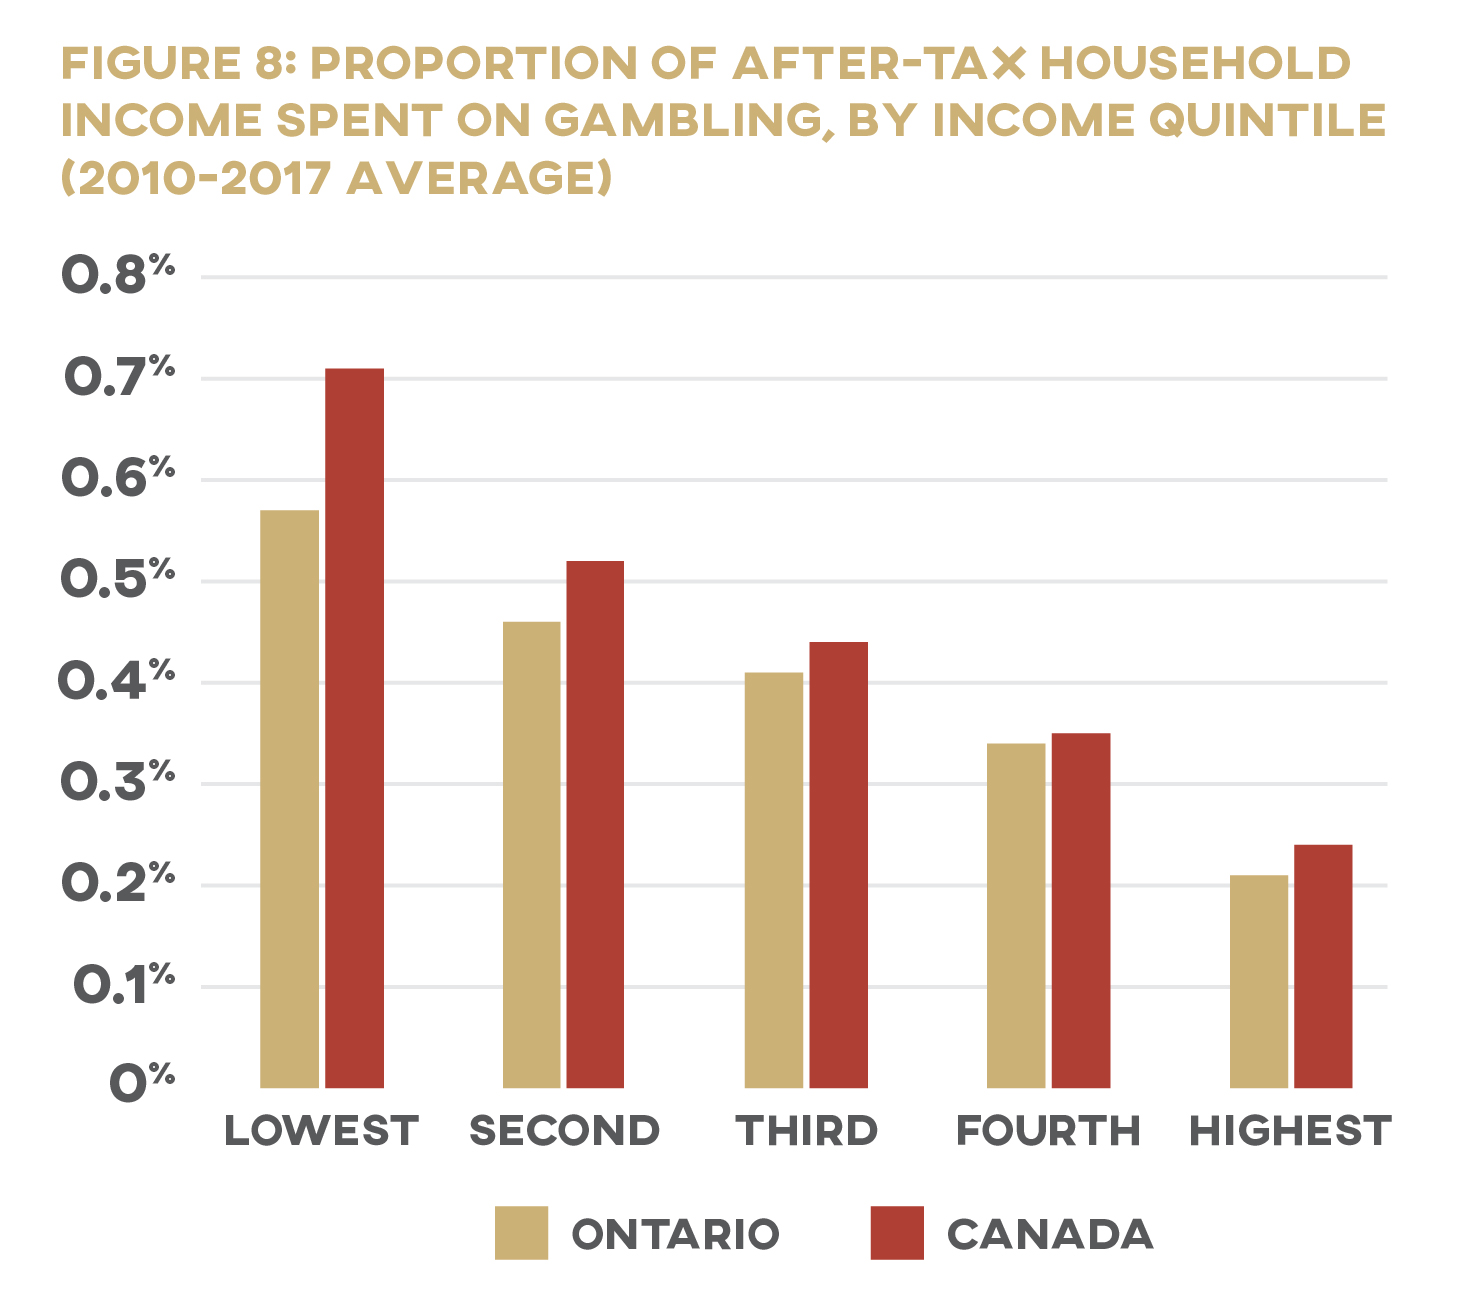
47) Authors’ calculations based on data from Statistics Canada, “Table 11-10-0223-01.” See appendix for details
48) All figures are authors’ calculations based on data from Statistics Canada’s Canada Income Survey and Survey of Household
Spending. See appendix for details. Statistics Canada, “Table 11-10-0223-01”; Statistics Canada, User Guide; Statistics Canada,
“Table 11-10-0193-01.”
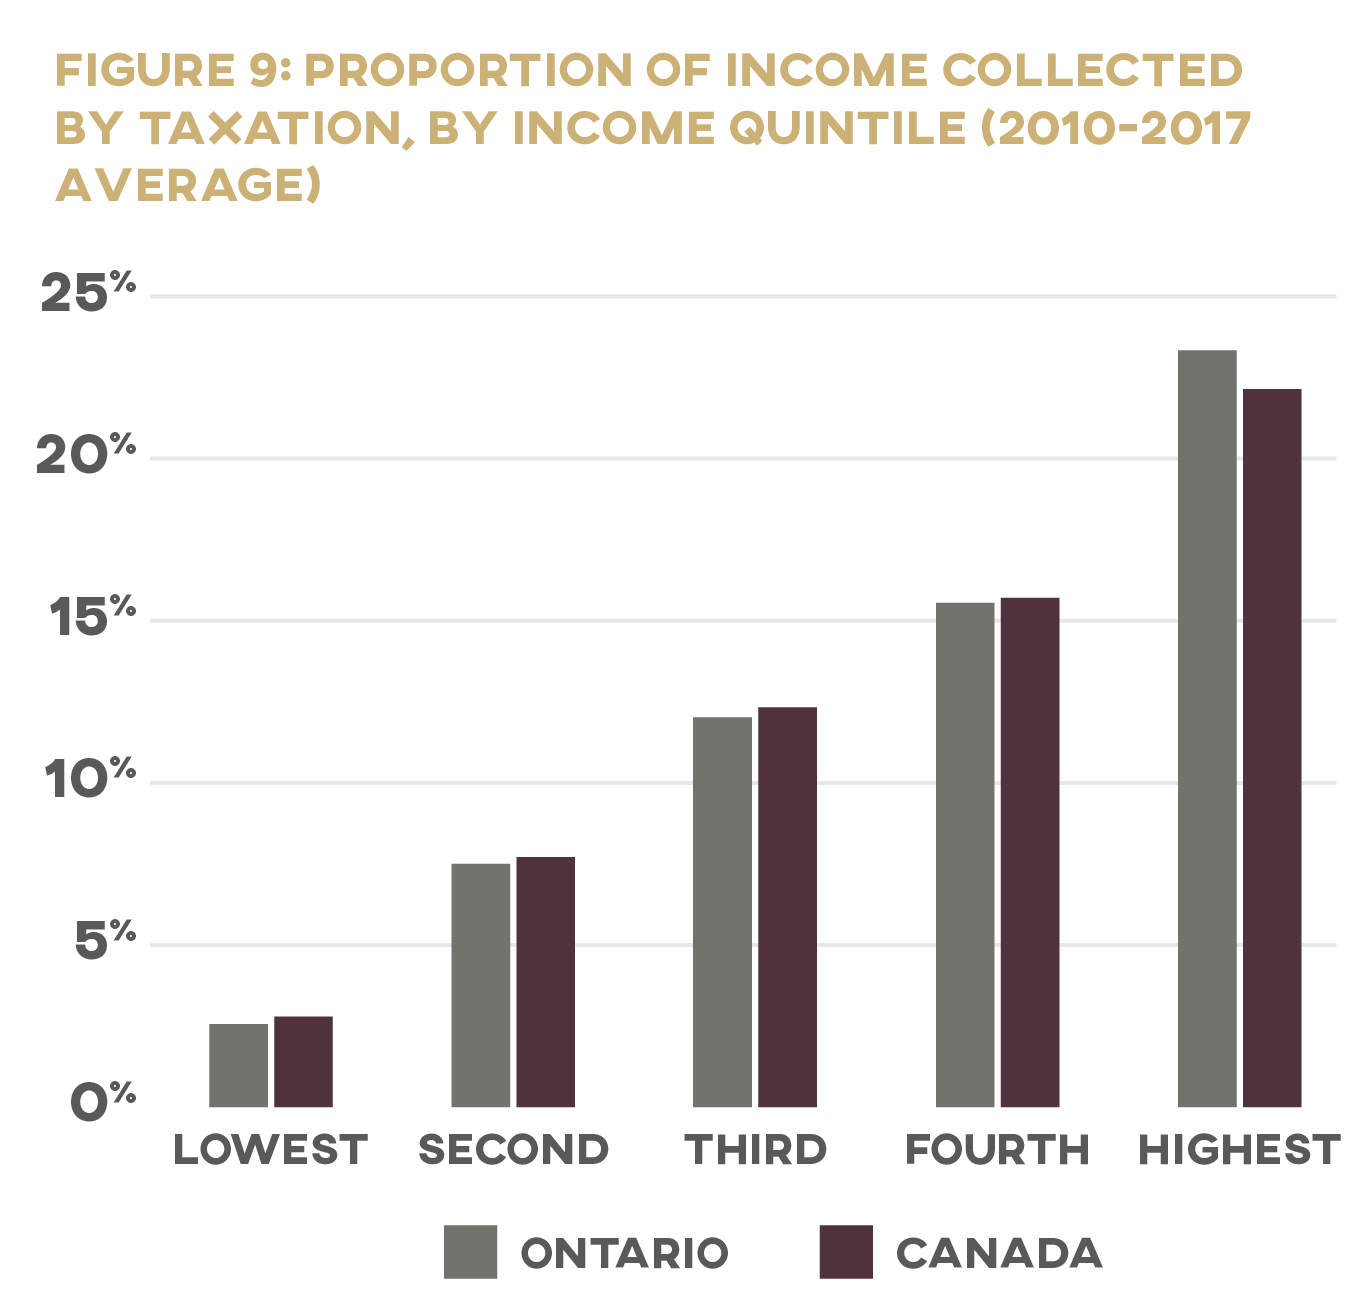
49) Authors’ calculations based on data from Statistics Canada, “Table 11-10-0193-01.”
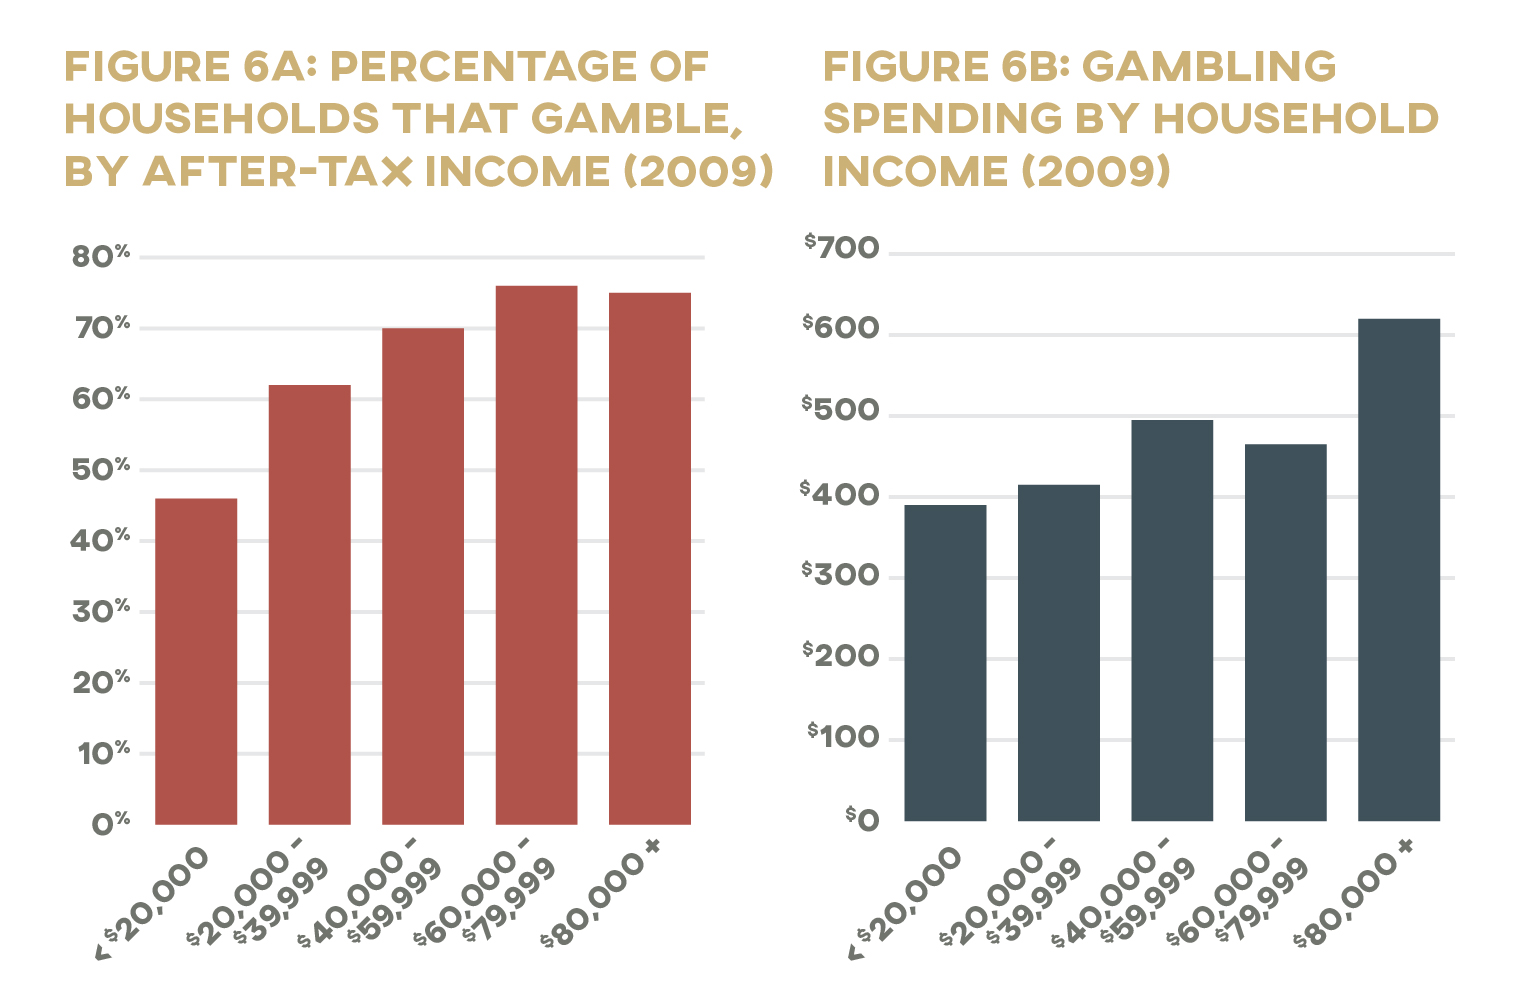
50) Williams and Volberg, “Gambling and Problem Gambling in Ontario,” 57. This report on gambling in Ontario, which was based on a survey of over 4,000 adults, found that those making under $20,000 per year spent 4% of their income gambling, more than double the proportion spent by those in higher-earning categories. The gambling-expenditure reports obtained by the authors of this study are likely more reliable than those obtained through the SHS, given their much closer match to actual OLG revenue (88.1%; see
below for comparative SHS figures). While acknowledging the unreliability of gambling-expenditure reports, the authors note that
“certain procedures have been shown to produce a reasonable approximation to gambling expenditure as recorded in daily diaries as well as actual jurisdictional gambling revenue” (33).
51) Ontario Legislative Assembly, Hansard, 34th Parl., 1st Sess., February 28, 1989, at 1750
52) See, e.g., MacDonald, McMullan, and Perrier, “Gambling Households in Canada”; Wisman, “State Lotteries”; Orford et al., “Role
of Social Factors,” 258; Bol, Lancee, and Steijn, “Income Inequality and Gambling,” 64; Lang and Omori, “Can Demographic Variables Predict,” 173; Castrén et al., “Relationship Between Gambling Expenditure,” 91–92.
53) Statistics Canada, “Table 36-10-0101-01.”
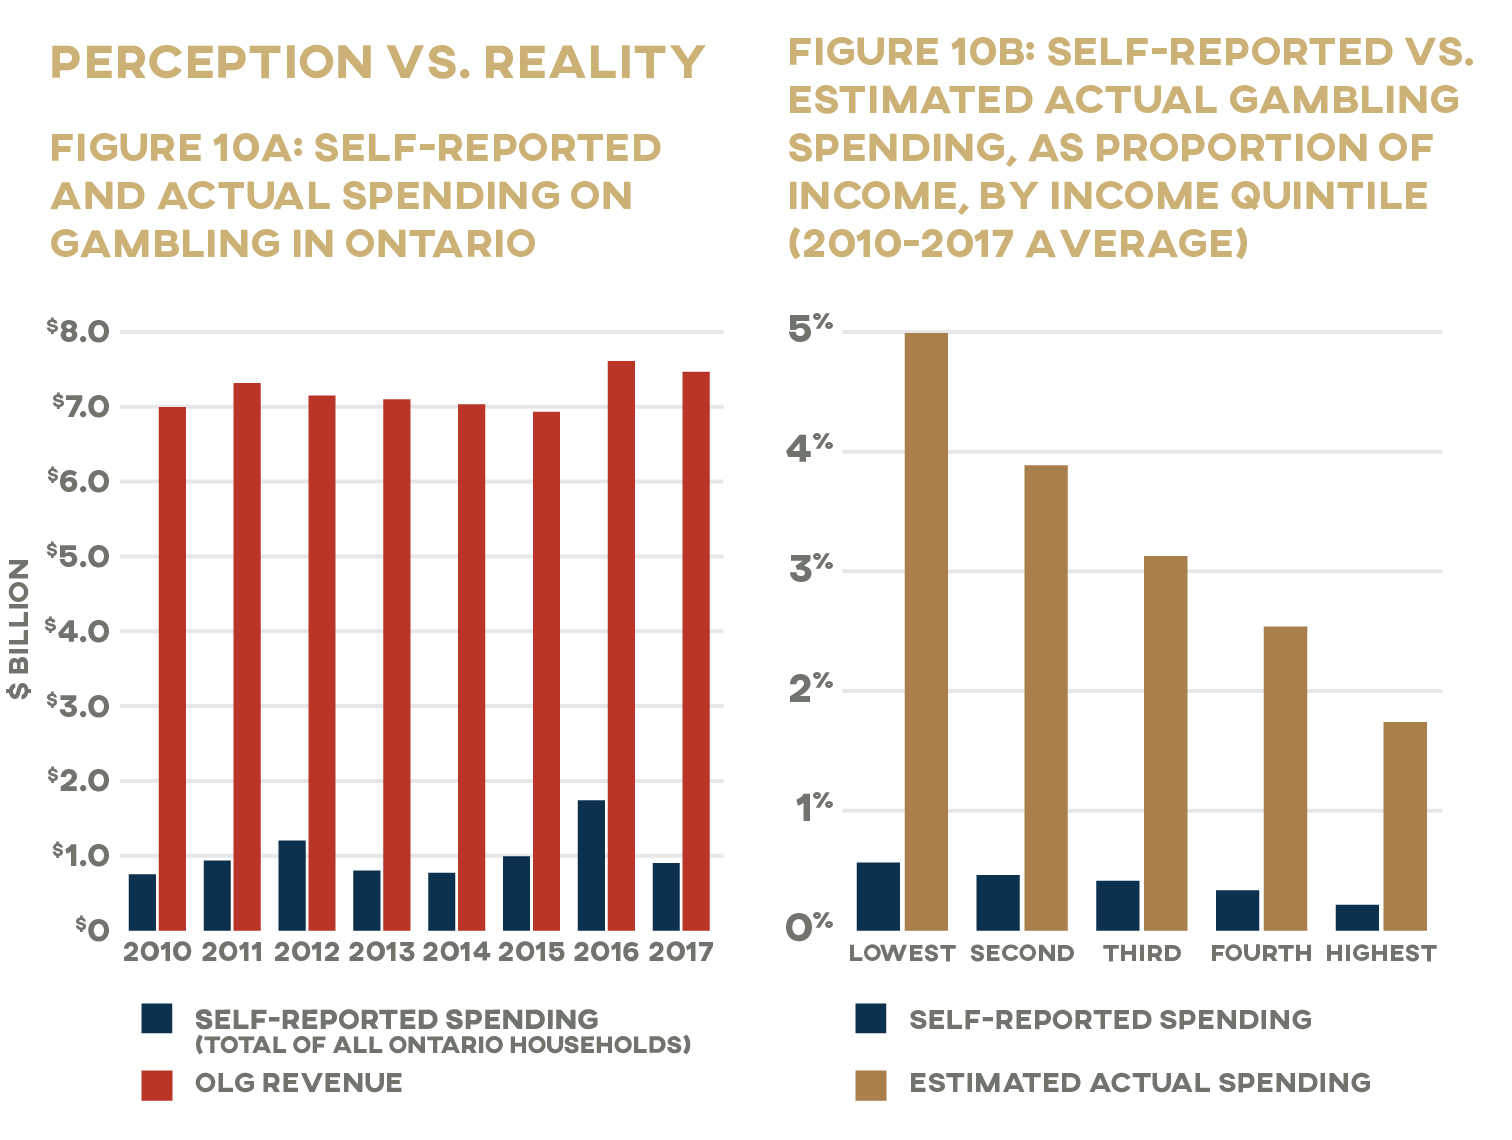
54) OLG, “OLG Annual Report 2016–17.”
55) Potential actual spending figures are estimates and should be treated with caution. Authors’ calculations based on OLG annual
reports and Statistics Canada, “Table 11-10-0223-01.” See appendix for calculation details.
56) Wood and Williams, “‘How Much Money.”
57) Financial Consumer Agency of Canada, “Canadians and Their Money: Key Findings
from the 2019 Canadian Financial Capability Survey,” https://www.canada.ca/en/
financial-consumer-agency/programs/research/canadian-financial-capability-survey-2019.html.
58) One of the biggest obstacles is the ambiguity surrounding the definition of “gambling,” both in academic reports and public opinion. Should shelling out a few dollars for raffle tickets at a charity fundraiser be classified as gambling, for instance? What about buying high-risk stocks or day-trading? Where’s the line between “gaming” and “gambling” (if it exists at all)? Researchers have answered these kinds of questions differently, which makes comparing statistics across multiple studies challenging. See, e.g., Zaloom, “Derivative World”; King et al., “Distinguishing Between Gaming and Gambling”; Williams et al., “Definition,
Dimensionalization”; Economist, “When Does Investing Become Gambling?”
59) Rodgers, Caldwell, and Butterworth, “Measuring Gambling Participation.”
60) Williams et al., “Gambling and Problem Gambling in Canada.”
61) For Canadian research, see, e.g., Abdel-Ghany and Sharpe, “Lottery Expenditures in Canada”; MacDonald, McMullan, and
Perrier, “Gambling Households in Canada.” For international research, see, e.g., Castrén et al., “Relationship Between Gambling
Expenditure”; Tan, Yen, and Nayga, “Socio-demographic Determinants.”
62) Davidson et al., Gambling Expenditure.
63) Beckert and Lutter, “Inequality of Fair Play,” 482.
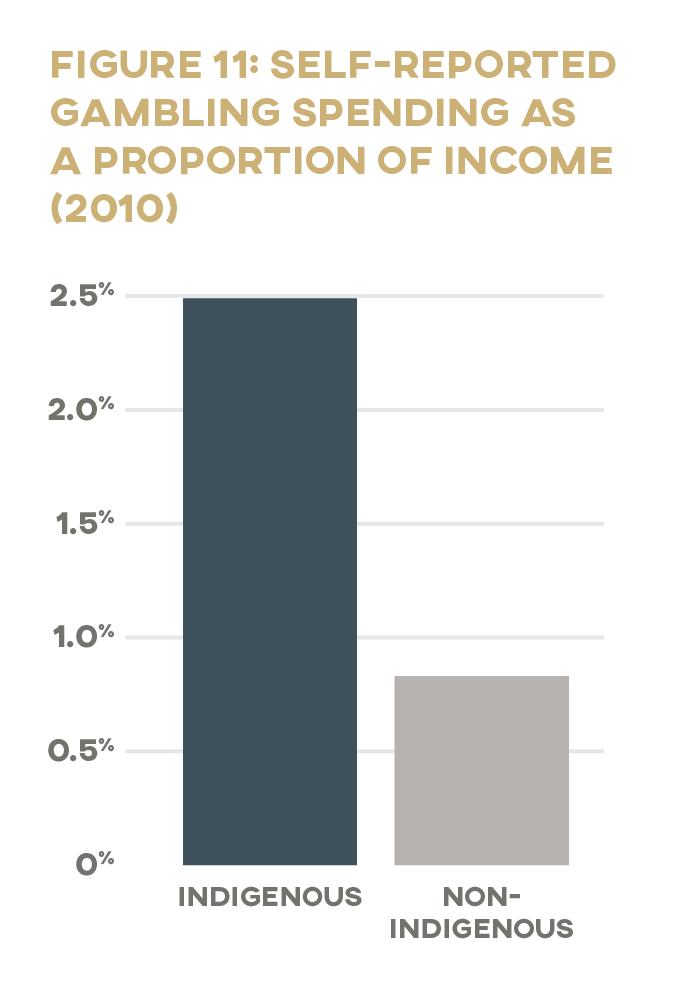
64) Speer, “Forgotten People.”
65) Income data from Statistics Canada, Aboriginal Statistics at a Glance. An in-depth review of the literature on gambling among
Indigenous communities is beyond the scope of this paper, but readers are encouraged to explore the substantial body of research on this topic. See, e.g., Breen and Gainsbury, “Aboriginal Gambling”; Wardman, El-Guebaly, and Hodgins, “Problem and Pathological Gambling”; Belanger, First Nations, 166–94; New Zealand Ministry of Health, “Gambling and Problem Gambling”; Dyall, “Gambling”;
Williams and Wood, “Demographic Sources”; Stevens and Young, “Betting on the Evidence”; Currie et al., “Racial Discrimination.”
66) For a collected summary of provincial gambling prevalence studies conducted in Canada, see Alberta Gambling Research
Institute, “Prevalence—Canada Provincial Studies.”
67) MacLaren, “Video Lottery,” 460; Wiebe and Volberg, “Problem Gambling Prevalence Research.”
68) For a concise overview of this research, see Volberg, McNamara, and Carris, “Risk Factors for Problem Gambling,” 360–63; see
also Lorains, Cowlishaw, and Thomas, “Prevalence of Comorbid Disorders”; Williams, Volberg, and Stevens, “Population Prevalence of Problem Gambling”; Sharman, “Gambling and Homelessness.”
69) Wardle et al., “Problem Gambling and Suicidal Thoughts.”
70) Williams and Volberg, “Gambling and Problem Gambling in Ontario”; Williams and Wood, “Demographic Sources”; Williams and
Wood, “What Proportion of Gambling Revenue.”
71) See, e.g., Orford, Wardle, and Griffiths, “What Proportion of Gambling”; Government of Australia, “Inquiry Report,” 5.35.
72) See, e.g., Bernhard and Philander, “Informing the Public Debate.”
73) Williams and Wood, “What Proportion of Gambling Revenue.” See also Cook, Paying the Tab. There is evidence to suggest that
“gambling is even more concentrated in a very small group of heavy users than most other harmful or risky consumer practices,” and that “the small minority of problem gamblers do not represent the population segments that can best bear [this] cost” (Sulkunen et al., Setting Limits, 169–71).
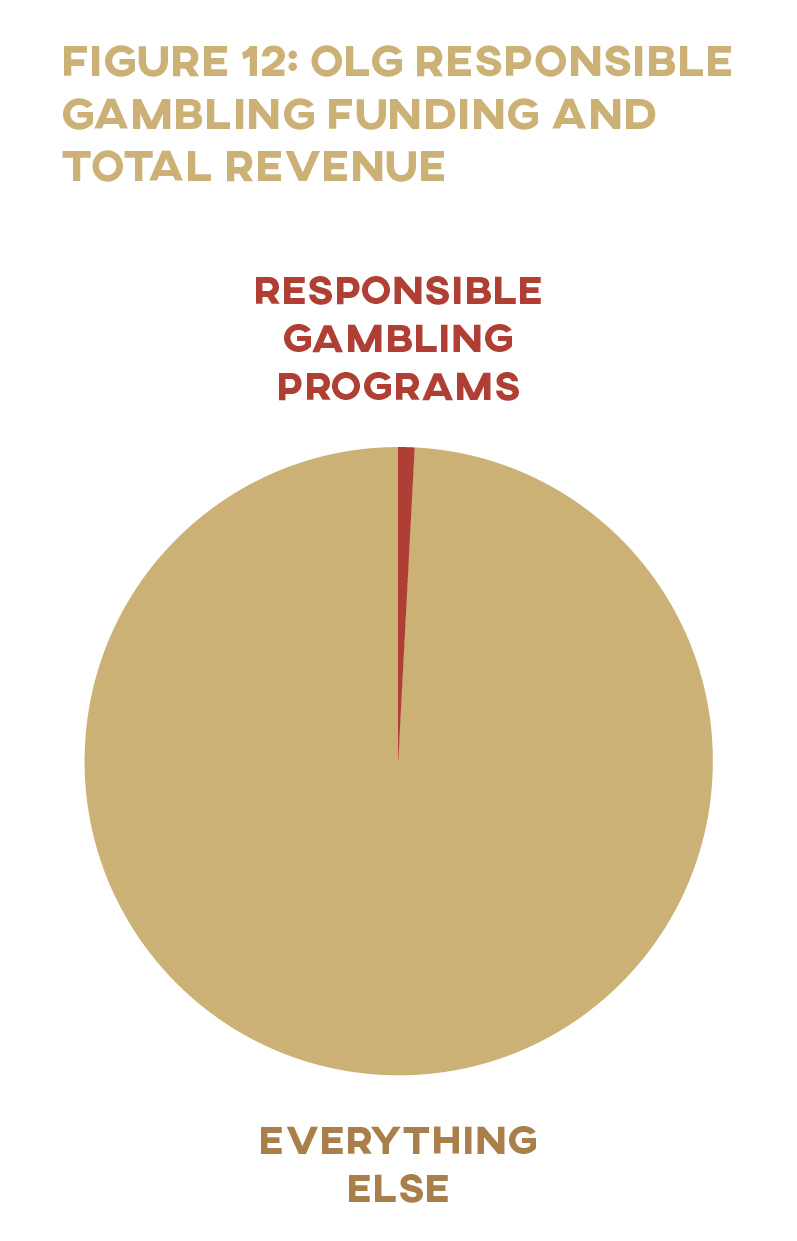
74) In 2017–18, OLG sent $45 million to the Ontario Ministry of Health and Long-Term Care—as per government policy directing 2% of annual forecasted gross slot-machine revenue to the ministry for the prevention, treatment, and research of problem gambling—
and spent $19.1 million internally on its responsible gambling programs (OLG, “Annual Report 2017–18,” 4–5). The change in
accounting practices that OLG adopted in April 2019 meant that the total sent to the ministry for problem-gambling programs was not available in the organization’s 2018–19 annual report. OLG did, however, reduce its spending on internal responsible-gambling programs to $17.3 million in that fiscal year (OLG, “Annual Report 2018–19,” 6).
75) OLG, “Annual Report 2017–18,” 4.
76) In Canada, EGMs are generally known as slot machines when located at traditional gaming facilities (i.e., casinos and racetracks)
and as video lottery terminals (VLTs) when found in pubs and bars. VLTs are illegal in Ontario and British Columbia. For research
on the addictive design of EGMs, see Schüll, Addiction by Design, discussed in Crawford, “Autism as a Design Principle,” 89–112;
MacLaren, “Video Lottery”; Gambling Research Exchange Ontario, “Slots and VLTs” and “About Slot Machines”; Rosengren, “How
Casinos Enable Gambling Addicts.” EGMs have been described by some researchers as “the crack cocaine of gambling” (Dowling,
Smith, and Thomas, “Electronic Gaming Machines”), though not all researchers fully endorse this designation. Dowling et al.
conclude that despite the consistent association in the literature between EGMs and “the highest level of problem gambling,” the evidence available at time of writing was insufficient to definitively “establish the absolute ‘addictive’ potential of EGMs” (42).
77) Charles Livingstone, “How Electronic Gambling Machines Work,” 2; see also Harrigan et al., “Research Briefing Note”; Harrigan,
“Gap Analysis”; Jensen et al., “Misinterpreting ‘Winning.’”
78) See appendix for calculation details.
79) OLG, “Responsible Gambling.”
80) Williams and Volberg, “Gambling and Problem Gambling in Ontario,” 28. Statistics Canada data from the same period was
comparable: Marshall reports in “Gambling 2011” that 19 percent of Ontario households reported playing “casinos, slot machines,
and VLTs” (6)
81) OLG, “Annual Report 2010–2011,” 61.
82) See appendix for calculation details.
83) See Cosgrave and Klassen, Casino State, 8. For a more detailed discussion of gambling-related crime and other unwanted
behaviours linked to gambling, see Campbell, Hartnagel, and Smith, “Legalization of Gambling in Canada,” 38–51.
84) OLG, “All Ontario Casinos to Temporarily Close”; OLG, “OLG Prize Centre to Temporarily Close.”
85) Gamblers Anonymous, “Recovery Program.”
86) See also Abbott et al., Conceptual Framework of Harmful Gambling, 14.
87) See Cosgrave and Klassen, Casino State, 10.
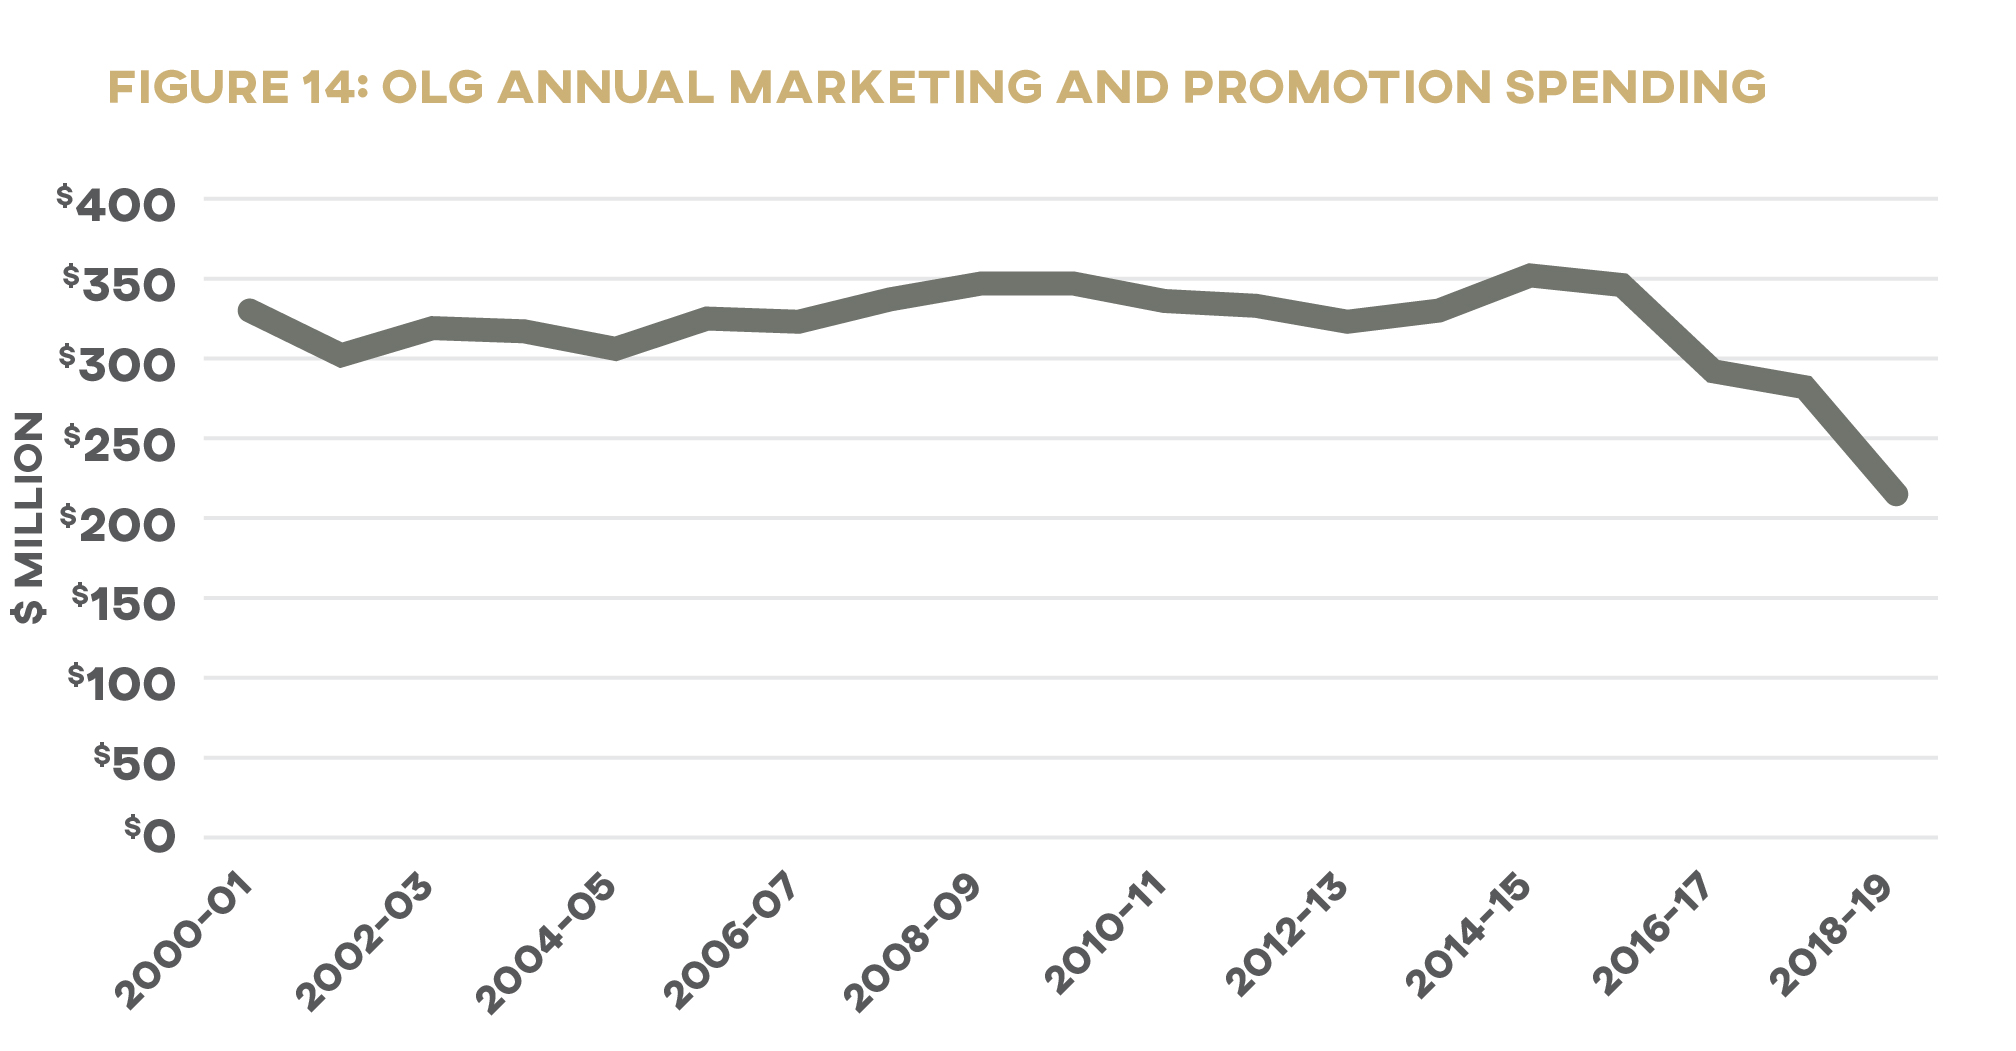
88) Figures taken from OLG annual reports and adjusted for inflation.
89) Cosgrave and Klassen, Casino State, 136. See also Hopper, “Why Canadian Governments Are Spending Millions.” A recent review
of the literature found a positive relationship between exposure to gambling advertising and gambling behaviour. Bouguettaya et al,
“The relationship between gambling advertising.”
90) AGCO, “Liquor Advertising.”
91) A few exemptions exist for specialty sellers. Ontario, “Rules for Selling”; Ontario, “Smoke-Free Ontario Act.”
92) See Williams, West, and Simpson, “Prevention of Problem Gambling,” 25–42; Williams and Wood, “What Proportion of
Gambling Revenue.”
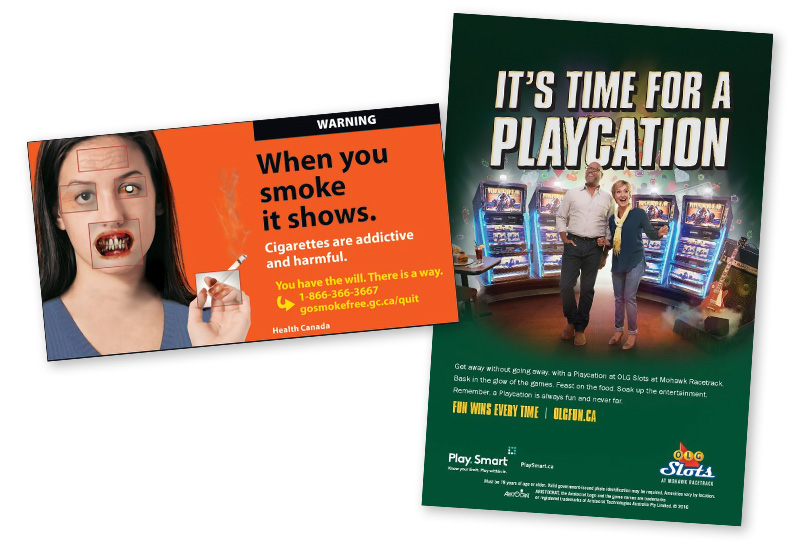
93) To be very clear, we are not arguing that gambling is as harmful an activity for individual and public health as smoking. That
said, we are affirming Doughney’s argument that there are meaningful parallels between EGMs and cigarettes—i.e., that both are
intrinsically “harmful or unsafe” and “powerfully control-impairing products. Regular use works to extinguish control by users, and it
is this that sets in motion the chain of events and decisions that can cause harm” (312). The addictive and harm potential of EGMs is
not identical to that of tobacco products, but the similarities are sufficient to illustrate the policy inconsistency. Doughney, “Ethical
Blindness,” 315.
94) See Government of Canada, “New Health Labelling.”
95) OLG, “Home Page.”
96) Image sources, Tobacco Labelling Resource Centre, https://tobaccolabels.ca/countries/canada/, Tourism Burlington, Ontario,
Canada, https://www.tourismburlington.com/partner/olg-slots/olgjpg/.
97) See also Institute for American Values, “For a New Thrift,” 25–26.
98) OLG, “Home Page”; see also Bernal, “American People.”
99) See, e.g., Milewski, “Federal Liberals Deride.”
100) Jones, Milligan, and Stabile, “Child Cash Benefits,” 16. Jones, Milligan, and Stabile note that their findings are consistent with
similar studies, such as Kaushal, Gao, and Waldfogel, “Welfare Reform”; McGranahan and Schanzenbach, “Earned Income Tax
Credit.”
101) Rothwell and Goren, “Exploring the Relationship”; McKernan, Ratcliffe, and Vinopal, “Do Assets Help Families Cope.”
102) Dijkema and McKendry, “Banking on the Margins,” 20.
103) Many Canadians are asset poor, making them particularly vulnerable to the loss of income accompanying an unexpected layoff.
See J. Robson, “Assets in the New Government”; Compass Working Capital, “Why Asset Poverty Matters”; McGill Newsroom, “Half of Canadians Don’t Have Enough Savings.”
104) Rothwell and Robson, “Prevalence and Composition”; McGill Newsroom, “Half of Canadians Don’t Have Enough Savings”; Alini,
“Coronavirus.”
105) Banerjee and Mullainathan, “Shape of Temptation,” 3; Karlan, “Helping the Poor Save More.”
106) Government of Canada, “Registered Education Savings Plans.”
107) Banerjee and Duflo, “Economic Lives of the Poor.”
108) Robson, “Does Canada Have a Hidden ‘Wealthfare’ System?”; Beverly et al., “Determinants of Asset Building,” ES-2; see
also Shillington, Are Low-Income Savers. Tax-Free Savings Accounts (TFSAs) were originally designed to provide a savings vehicle appropriate to low-income Canadians, especially low-income seniors. However, there has not been a significant transition from RRSPs to TFSAs among low-income savers in the ten years since TFSAs were introduced, likely because “financial institutions are
not tailoring appropriate financial advice to low-income savers” (7). In fact, it is high-wealth savers—those already most targeted by financial institutions offering tailored advice on maximizing wealth—who are increasingly reaping the benefits of TFSAs.
109) See Institute for American Values, “For a New Thrift,” 29–31.
110) Institute for American Values, “American Declaration,” 4.
111) MacNeil et al., “False Eden of Gambling.”
112) Cosgrave and Klassen, Casino State, 8–9.
113) Crawford, World Beyond Your Head.
114) That is, until the player no longer has any money to continue playing. Schüll, Addiction by Design; Crawford, “Autism as a Design
Principle”; Dowling, Smith, and Thomas, “Electronic Gaming Machines”; MacLaren, “Video Lottery”; Gambling Research Exchange
Ontario, “Slots and VLTs”; Centre for Addiction and Mental Health, “About Slot Machines”; Rosengren, “How Casinos Enable
Gambling Addicts.” The rapid expansion of online gambling raises similar concerns: in their 2007 review of the literature on internet
gambling, Williams and Wood find “good evidence that online gamblers are significantly more likely to be problem gamblers” (24);
they also note that the outsized proportion of gambling revenue contributed by problem gamblers “is likely to be even higher for
online gambling” (25). Williams and Wood, “Internet Gambling”; see also Gambling Research Exchange Ontario, “Online Gambling.”
115) See Dickerson, Measurement, cited in Cosgrave and Klassen, Casino State, 146.
116) Crawford, “Autism as a Design Principle,” 107.
117) See, e.g., OLG video advertisements at Justin Dallaire, “Lotto Max.”
118) OLG, “PlaySmart.”
119) See Smith, Imagining the Kingdom.
120) Shun, “Rising Ontario Household Debt”; Ontario Treasury Board Secretariat, Public Accounts of Ontario 2018–19
121) Dieleman et al., “Report 28,” 265.
122) Henry Fielding, 1732, quoted in Chambers, “Nod to Lotteries.”
123) Dadayan, “State Revenues from Gambling.”
124) See, e.g., James Cosgrave’s comments in Baxter, “Why Expanding Casinos,” and in Frank, “Casinos”; see also Institute for
American Values, “American Declaration.” And while some—including, of course, the OLG—insist that gambling creates jobs,
others have countered that “most of the jobs created in gambling only substitute one for one (at best) for the jobs destroyed
when expenditure switches from other activities.” Henriksson and Lipsey, “Should Provinces Expand Gambling?,” 263. Indeed, a
comprehensive national report on gambling commissioned by the Australian government noted that if gambling were scaled back,
“some tax revenue would be lost. However, spending diverted from gambling would still be taxed, so the actual loss in revenue
would not be equivalent to the apparent loss in revenue” (Government of Australia, Inquiry Report, 6.40).
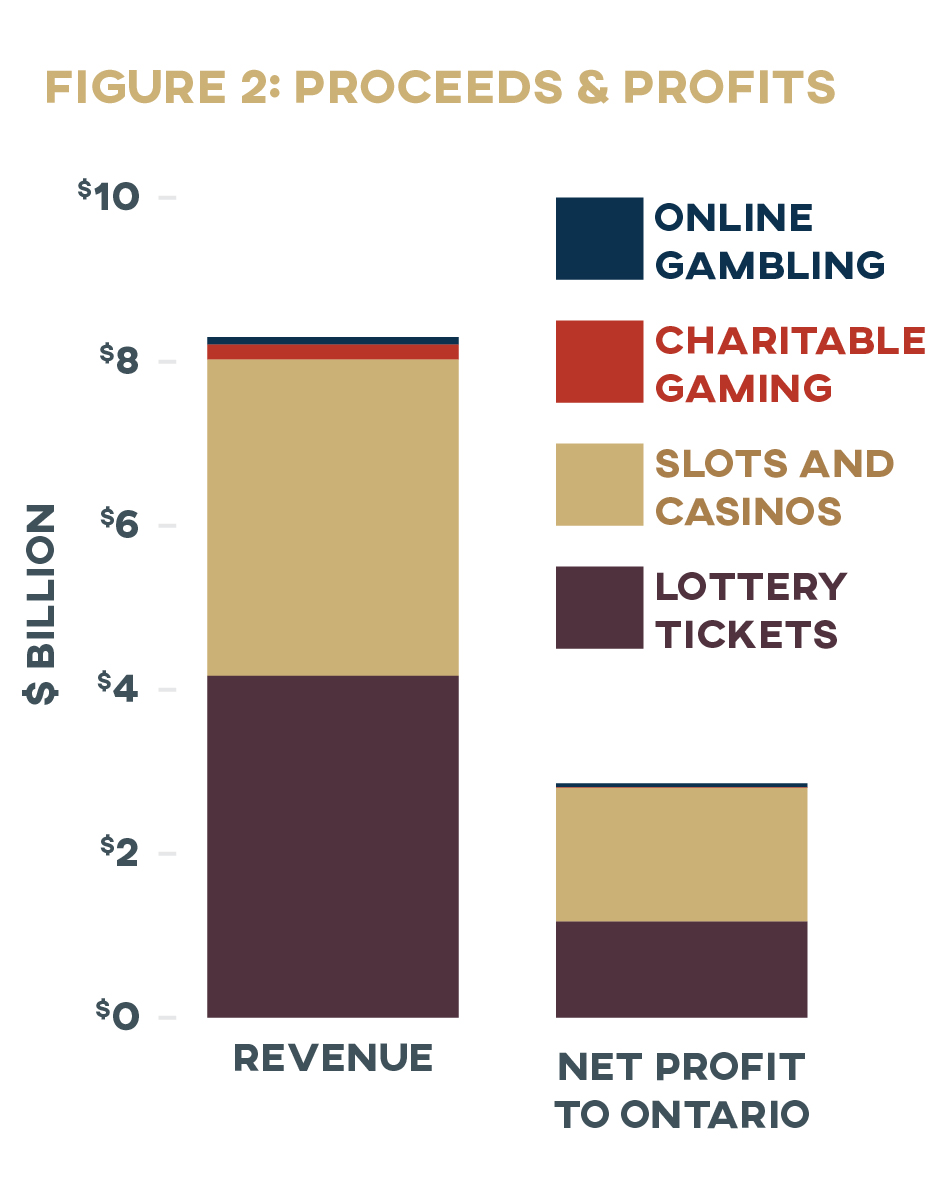
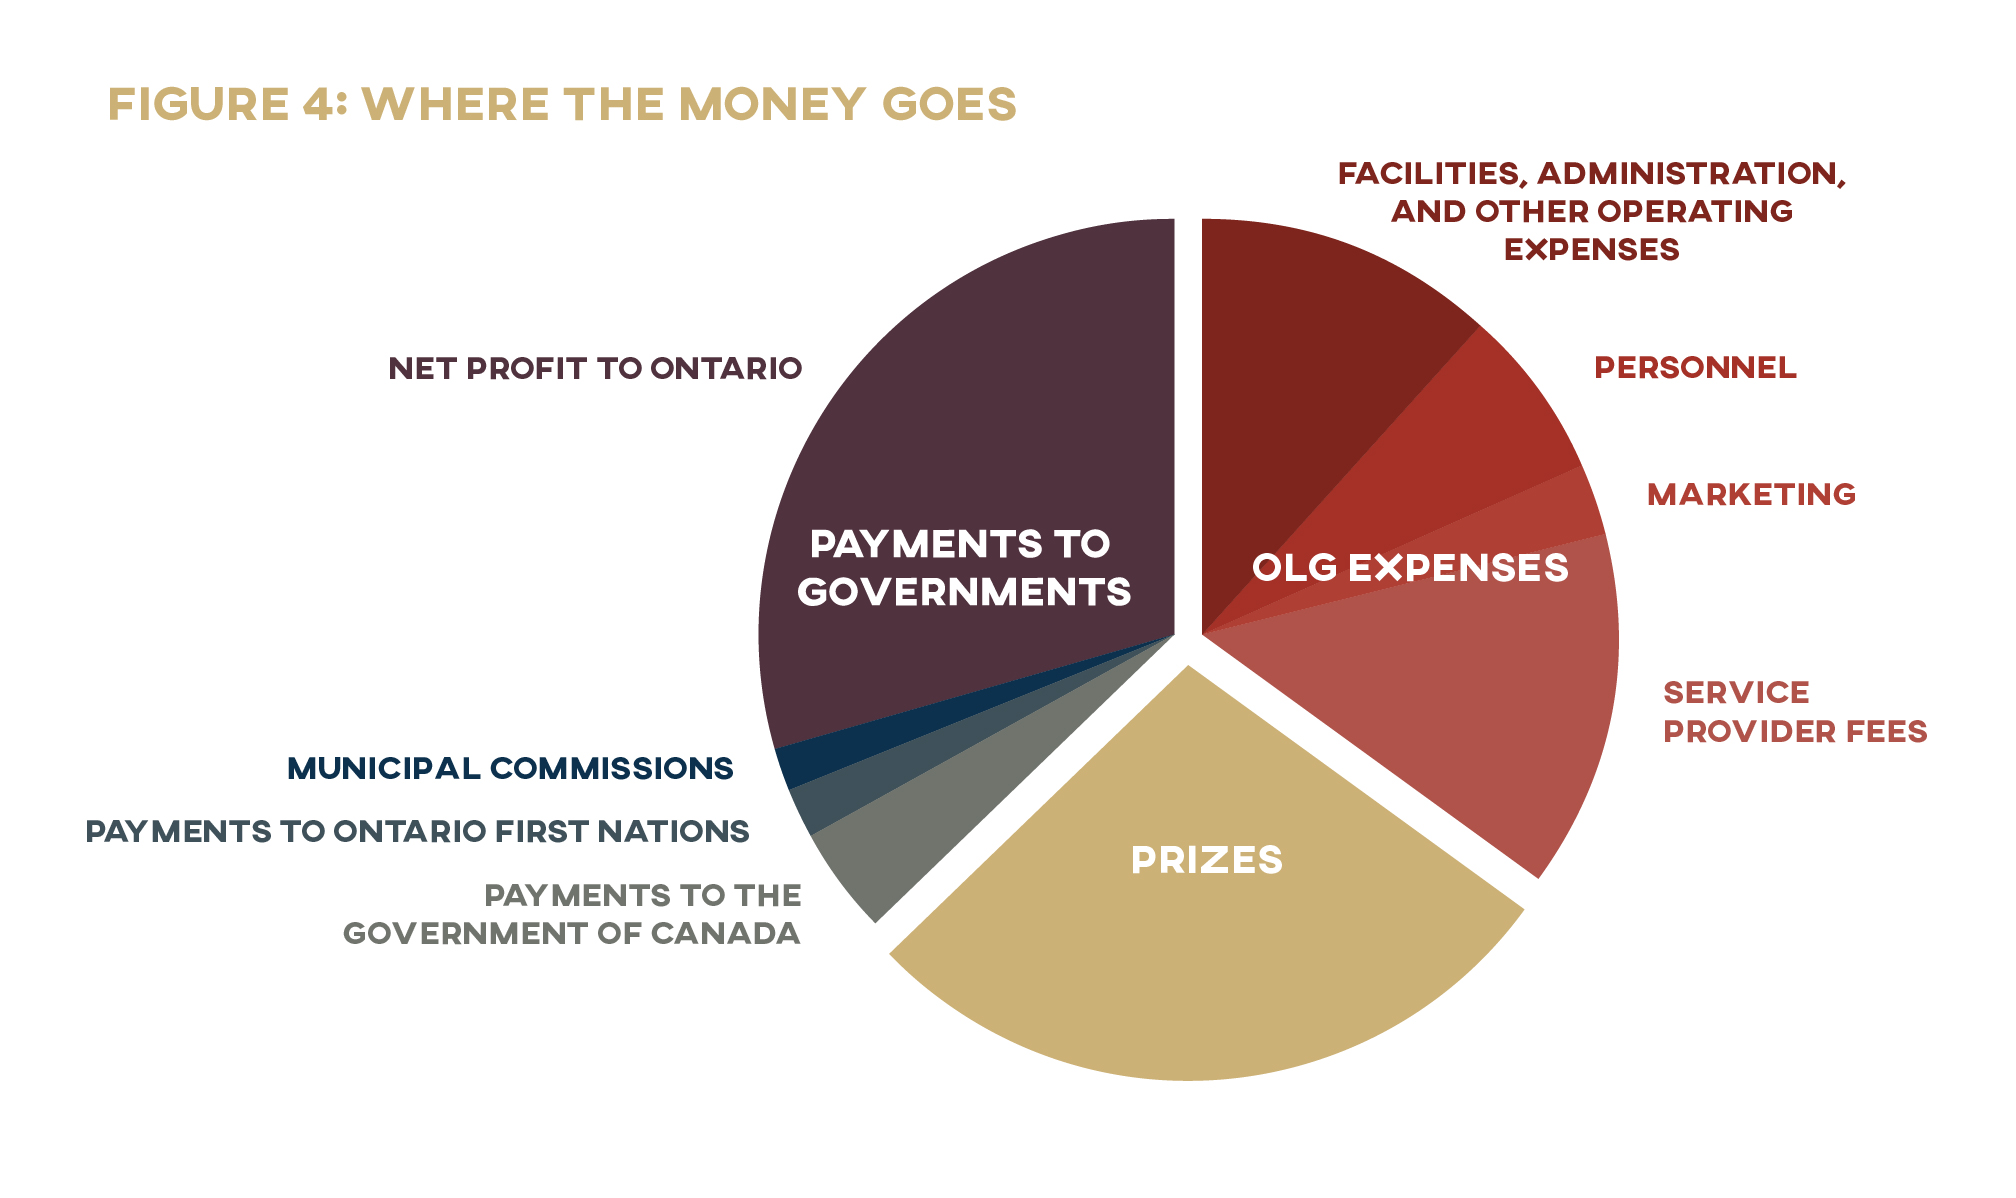
125) OLG’s net win was $5.97 billion in 2018–19; Ontario received $2.47 billion of this total, with the rest being used to cover
expenses. See above, “Where the Chips Lie,” and OLG, “Annual Report 2018–19.”
126) Dieleman et al., “Report 28,” 265
127) Leman et al., “Report 28,” 265; see also Pontifical Council for Justice and Peace, Compendium; Moscovich, Gambling with Our
(Kids’) Futures.
128) McCloskey, “Bourgeois Virtues?”
129) Prior to 2019, the CWB was known at the Working Income Tax Benefit (Government of Canada, “Canada Workers Benefit”).
130) Boshara, “Individual Development Accounts”; Comptroller of the Currency, “Individual Development Accounts”; Rothwell and Sultana, “Cash-Flow and Savings Practices.” See also Sherraden, Assets and the Poor; Sherraden, McBride, and Beverly, Striving to
Save.
131) See Boshara, “Individual Development Accounts.”
132) Save to Win, “History of Save to Win”; Michigan Credit Union League, “Save to Win.”
133) Eckert, “Two Years Later.”
134) Filiz-Ozbay et al., “Do Lottery Payments”; Atalay et al., “Savings and Prize-Linked Savings Accounts,” 101; Kearney et al.,
“Making Savers Winners,” 5, 12; Tufano, “Saving Whilst Gambling,” 322; Commonwealth, “Prize-Linked Savings.”
135) Walker, “How to Trick People into Saving”; Commonwealth, “Walmart MoneyCard Prize Savings”; Kearney et al., “Making Savers
Winners,” 18; Cole, Iverson, and Tufano, “Can Gambling Increase Savings?,” 2; Commonwealth, “State of Prize-Linked Savings.”
136) Cole, Iverson, and Tufano, “Can Gambling Increase Savings?” 37; Atalay et al., “Savings and Prize-Linked Savings Accounts,”
100; Filiz-Ozbay et al., “Do Lottery Payments,” 17; Pew Charitable Trusts, “Can Contests Help”; Commonwealth, “Prize-Linked Savings.”
137) Kearney et al., “Making Savers Winners,” 2–6.
138) And given the evidence that saving in PLS accounts can act as a substitute for lottery expenditure, we anticipate opposition
from the gambling industry. See Cole, Iverson, and Tufano, “Can Gambling Increase Savings?,” 2; Filiz-Ozbay et al., “Do Lottery
Payments,” 17–18; Kearney et al., “Making Savers Winners,” 12–14.
139) Pew Charitable Trusts, “Can Contests Help”; see also Commonwealth, “State of Prize-Linked Savings.”
140) National Savings and Investments, “Premium Bonds.”
141) Barker, “Premium Bonds.”
142) See above discussion of problem gambling. OLG, “Annual Report 2017–18,” 4–5, 43.
143) Newall et al., “Gambling Marketing,” 54.
144) OLG, “Annual and Financial Reports.”
145) Legislative Assembly of Ontario, “Index of /ser/187757.”
146) Internet Archive, “Public Accounts of Ontario”; Ontario, “Public Accounts of Ontario: Past Editions.” OLG figures for 2001–2 were accessed at Ontario, Public Accounts of Ontario 2001–2002. Digital versions of OLC annual reports for years 1976–87 have also
been made available by the McGill University Library at the McGill Digital Archive: Canadian Corporate Reports Project. See McGill Libraries, “Canadian Corporate Reports.”
147) Statistics Canada, “Table 11-10-0193-01.”
148) Total income refers to “income from all sources including government transfers and before deduction of federal and provincial
income taxes,” while after-tax income refers to “total income less income tax.” Statistics Canada adjusts these figures according to
household size: “In order to take into account the economies of scale present in larger households, the different types of income are adjusted by dividing the household income by the square root of the household size” (Statistics Canada, “Table 11-10-0193-01”).
149) Statistics Canada, “Table 11-10-0223-01.”
150) This category is defined as “Expenditures for all types of games of chance. The expenditures are not net of the winnings from
these games.” (Statistics Canada, User Guide).
151) When the CV (coefficient of variation) of a cell on a Statistics Canada data table is 35 or higher, the cell lists “F” instead of a
numerical value.
152) Statistics Canada, “Table 36-10-0101-01.”
153) While the authors are unaware of any research regarding patterns of under- or overestimation of gambling expenditure as a
function of income quintile, there is evidence to suggest that problem gambling does not have a significant impact on expenditure
reporting errors. One study “found gambling expenditure exaggeration and minimization to be equally common for all four
types of gamblers. . . . If there is an over or underestimate of expenditures relative to revenues, it probably does not affect the
proportion derived from problem gamblers because of equivalent exaggeration/minimization in each group” (Williams and Wood,
“Demographic Sources,” 42–43).
154) See Fendrich and Vaughn, “Diminished Lifetime Substance Use”; Fendrich and Kim, “Multiwave Analysis”; Fendrich and Johnson, “Race/Ethnicity Differences.”
155) Methodology adapted from Williams and Volberg, “Gambling and Problem Gambling in Ontario.”
156) Though 2009–10 data were not compared to SHS figures, these data were included to improve accuracy of calculation
estimates based on averages.
157) We acknowledge that some portion of this OLG revenue was likely derived from out-of-province residents, but given that
similar gaming options are available in other Canadian provinces, it is reasonable to assume that such revenue does not represent a significant share of OLG revenue. For a discussion of this issue and calculations supporting a similar conclusion in the context of Alberta, see Williams, Belanger, and Arthur, “Gambling in Alberta,” 93–94.
158) While every effort has been made to ensure that these figures are reasonably accurate, we acknowledge that some of the
assumptions informing the calculation of these figures are supported by somewhat limited evidence. As such, these figures should be used with caution.
159) Methodology adapted from Williams and Volberg, “Gambling and Problem Gambling in Ontario.”
160) Figures in this table are not adjusted for inflation.